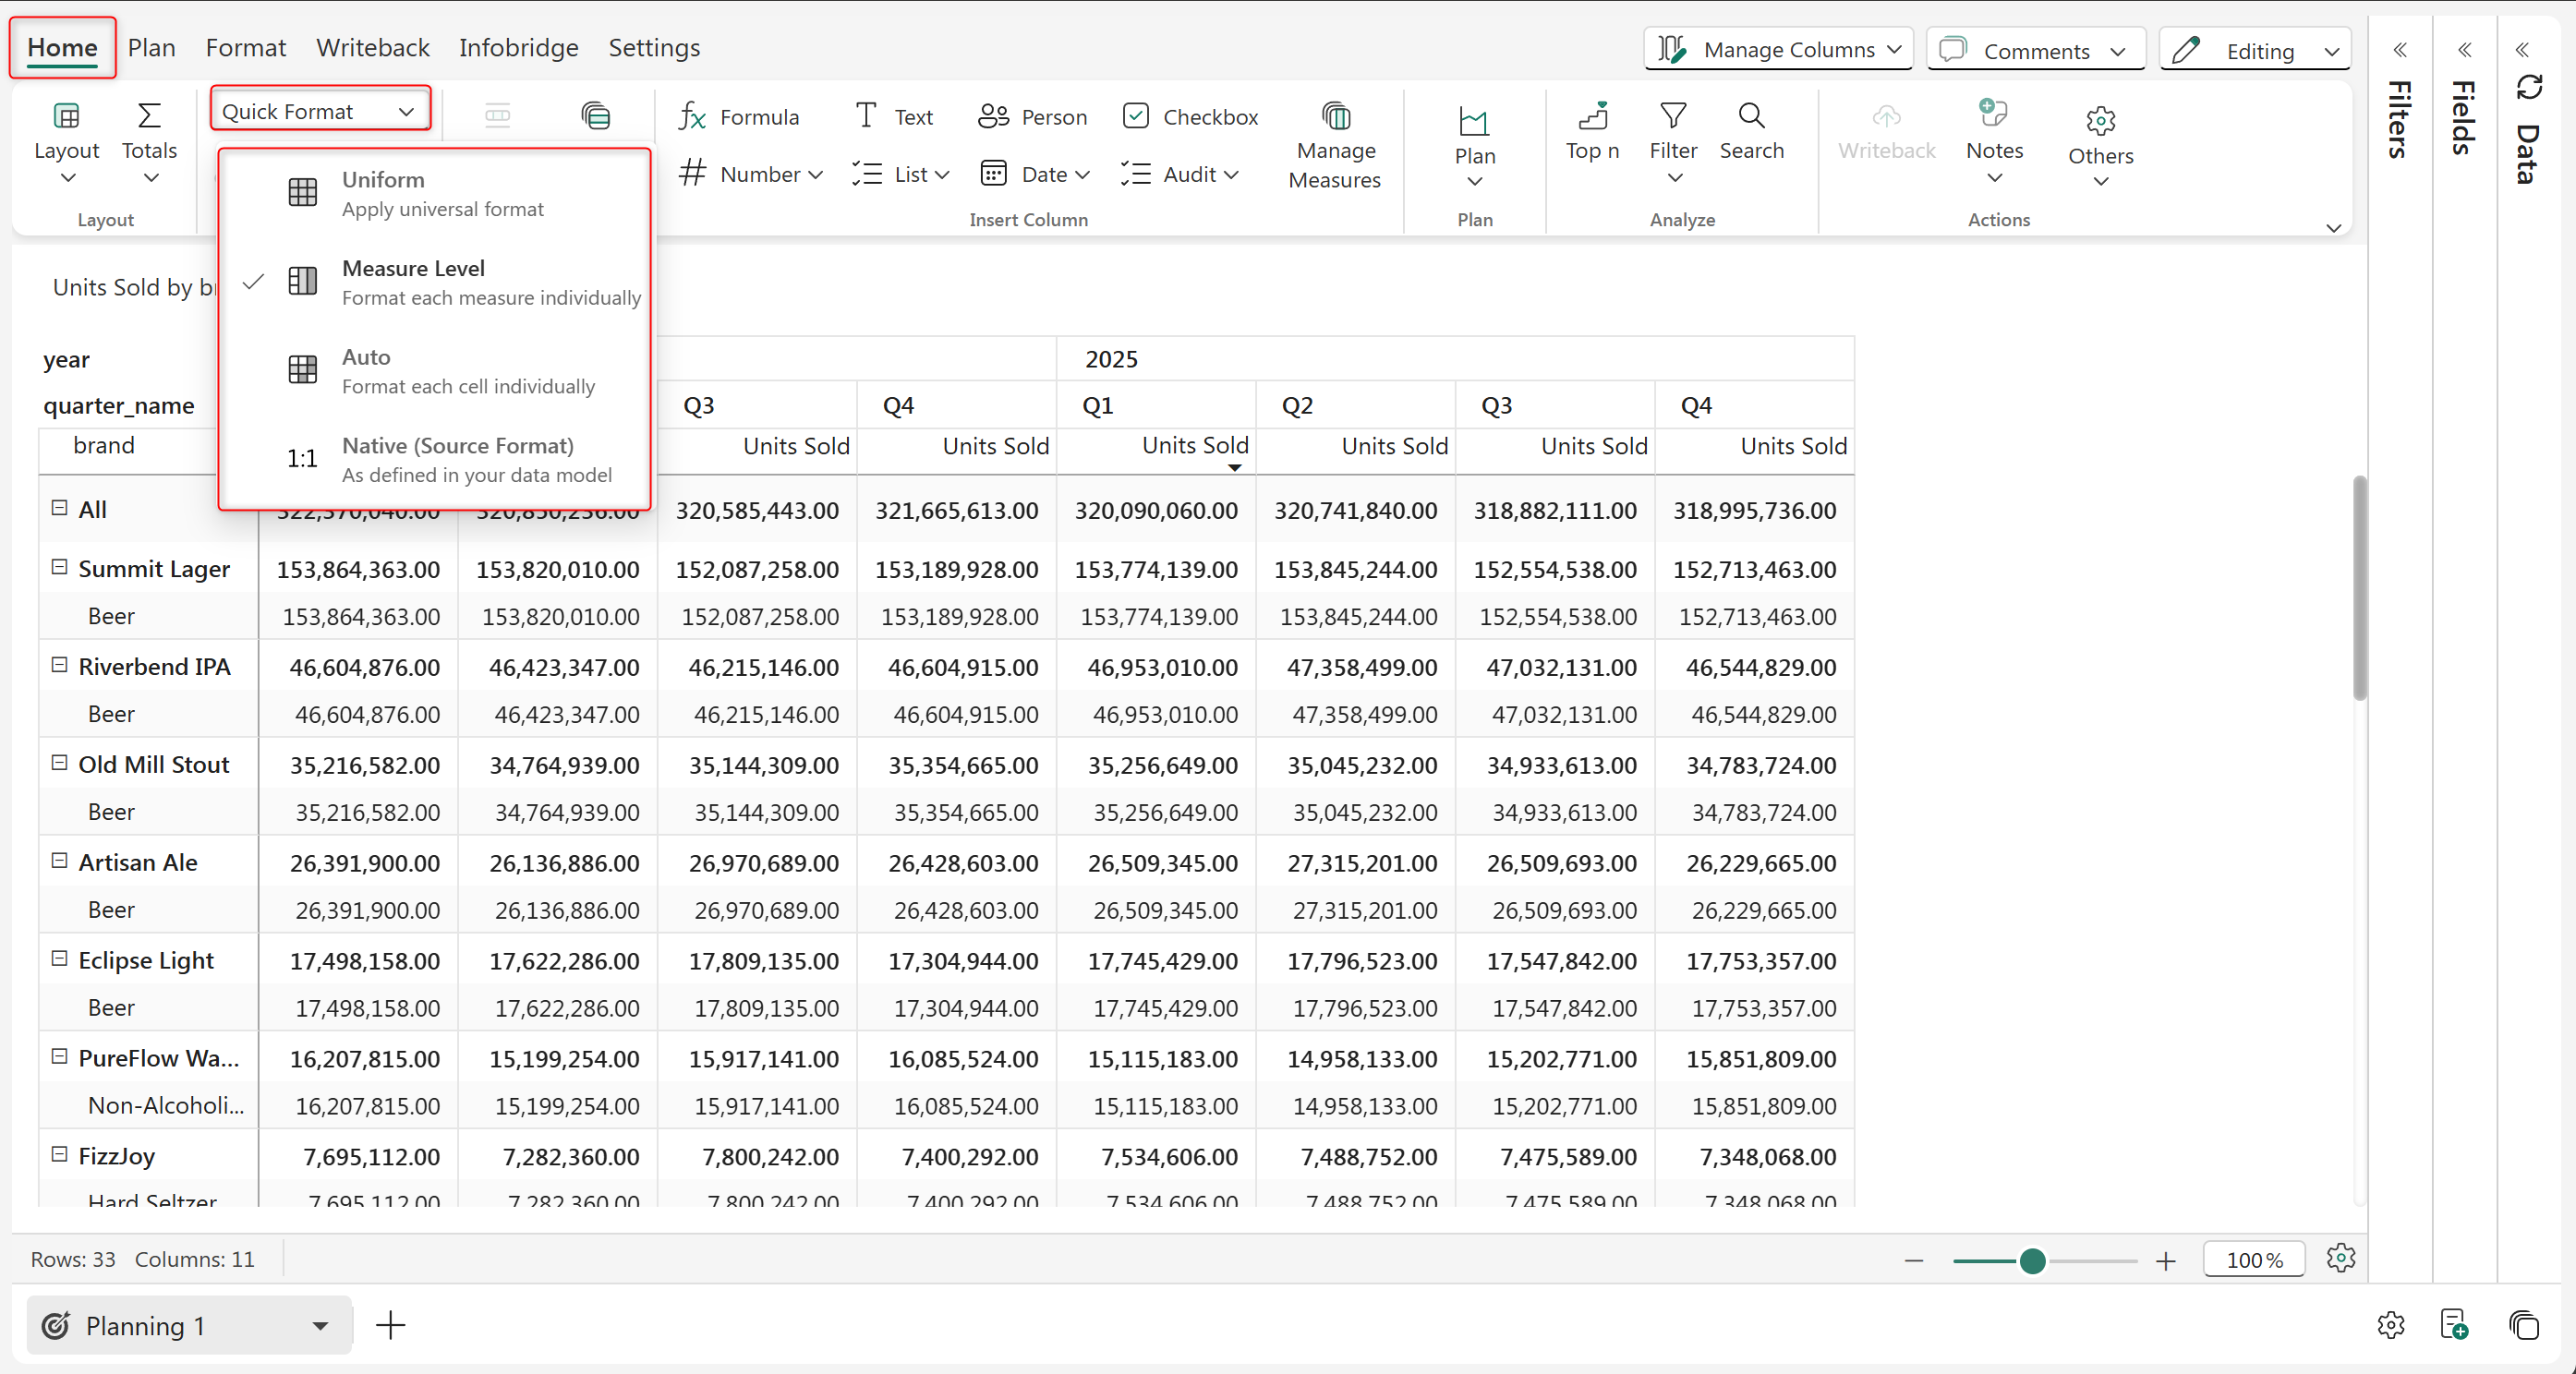
Quick Format Options
### a. Uniform scaling The 'Uniform' option applies one fixed scale to the entire table and moves the scaling unit display to the header. This is useful when all the measures are of comparable magnitude in the same table.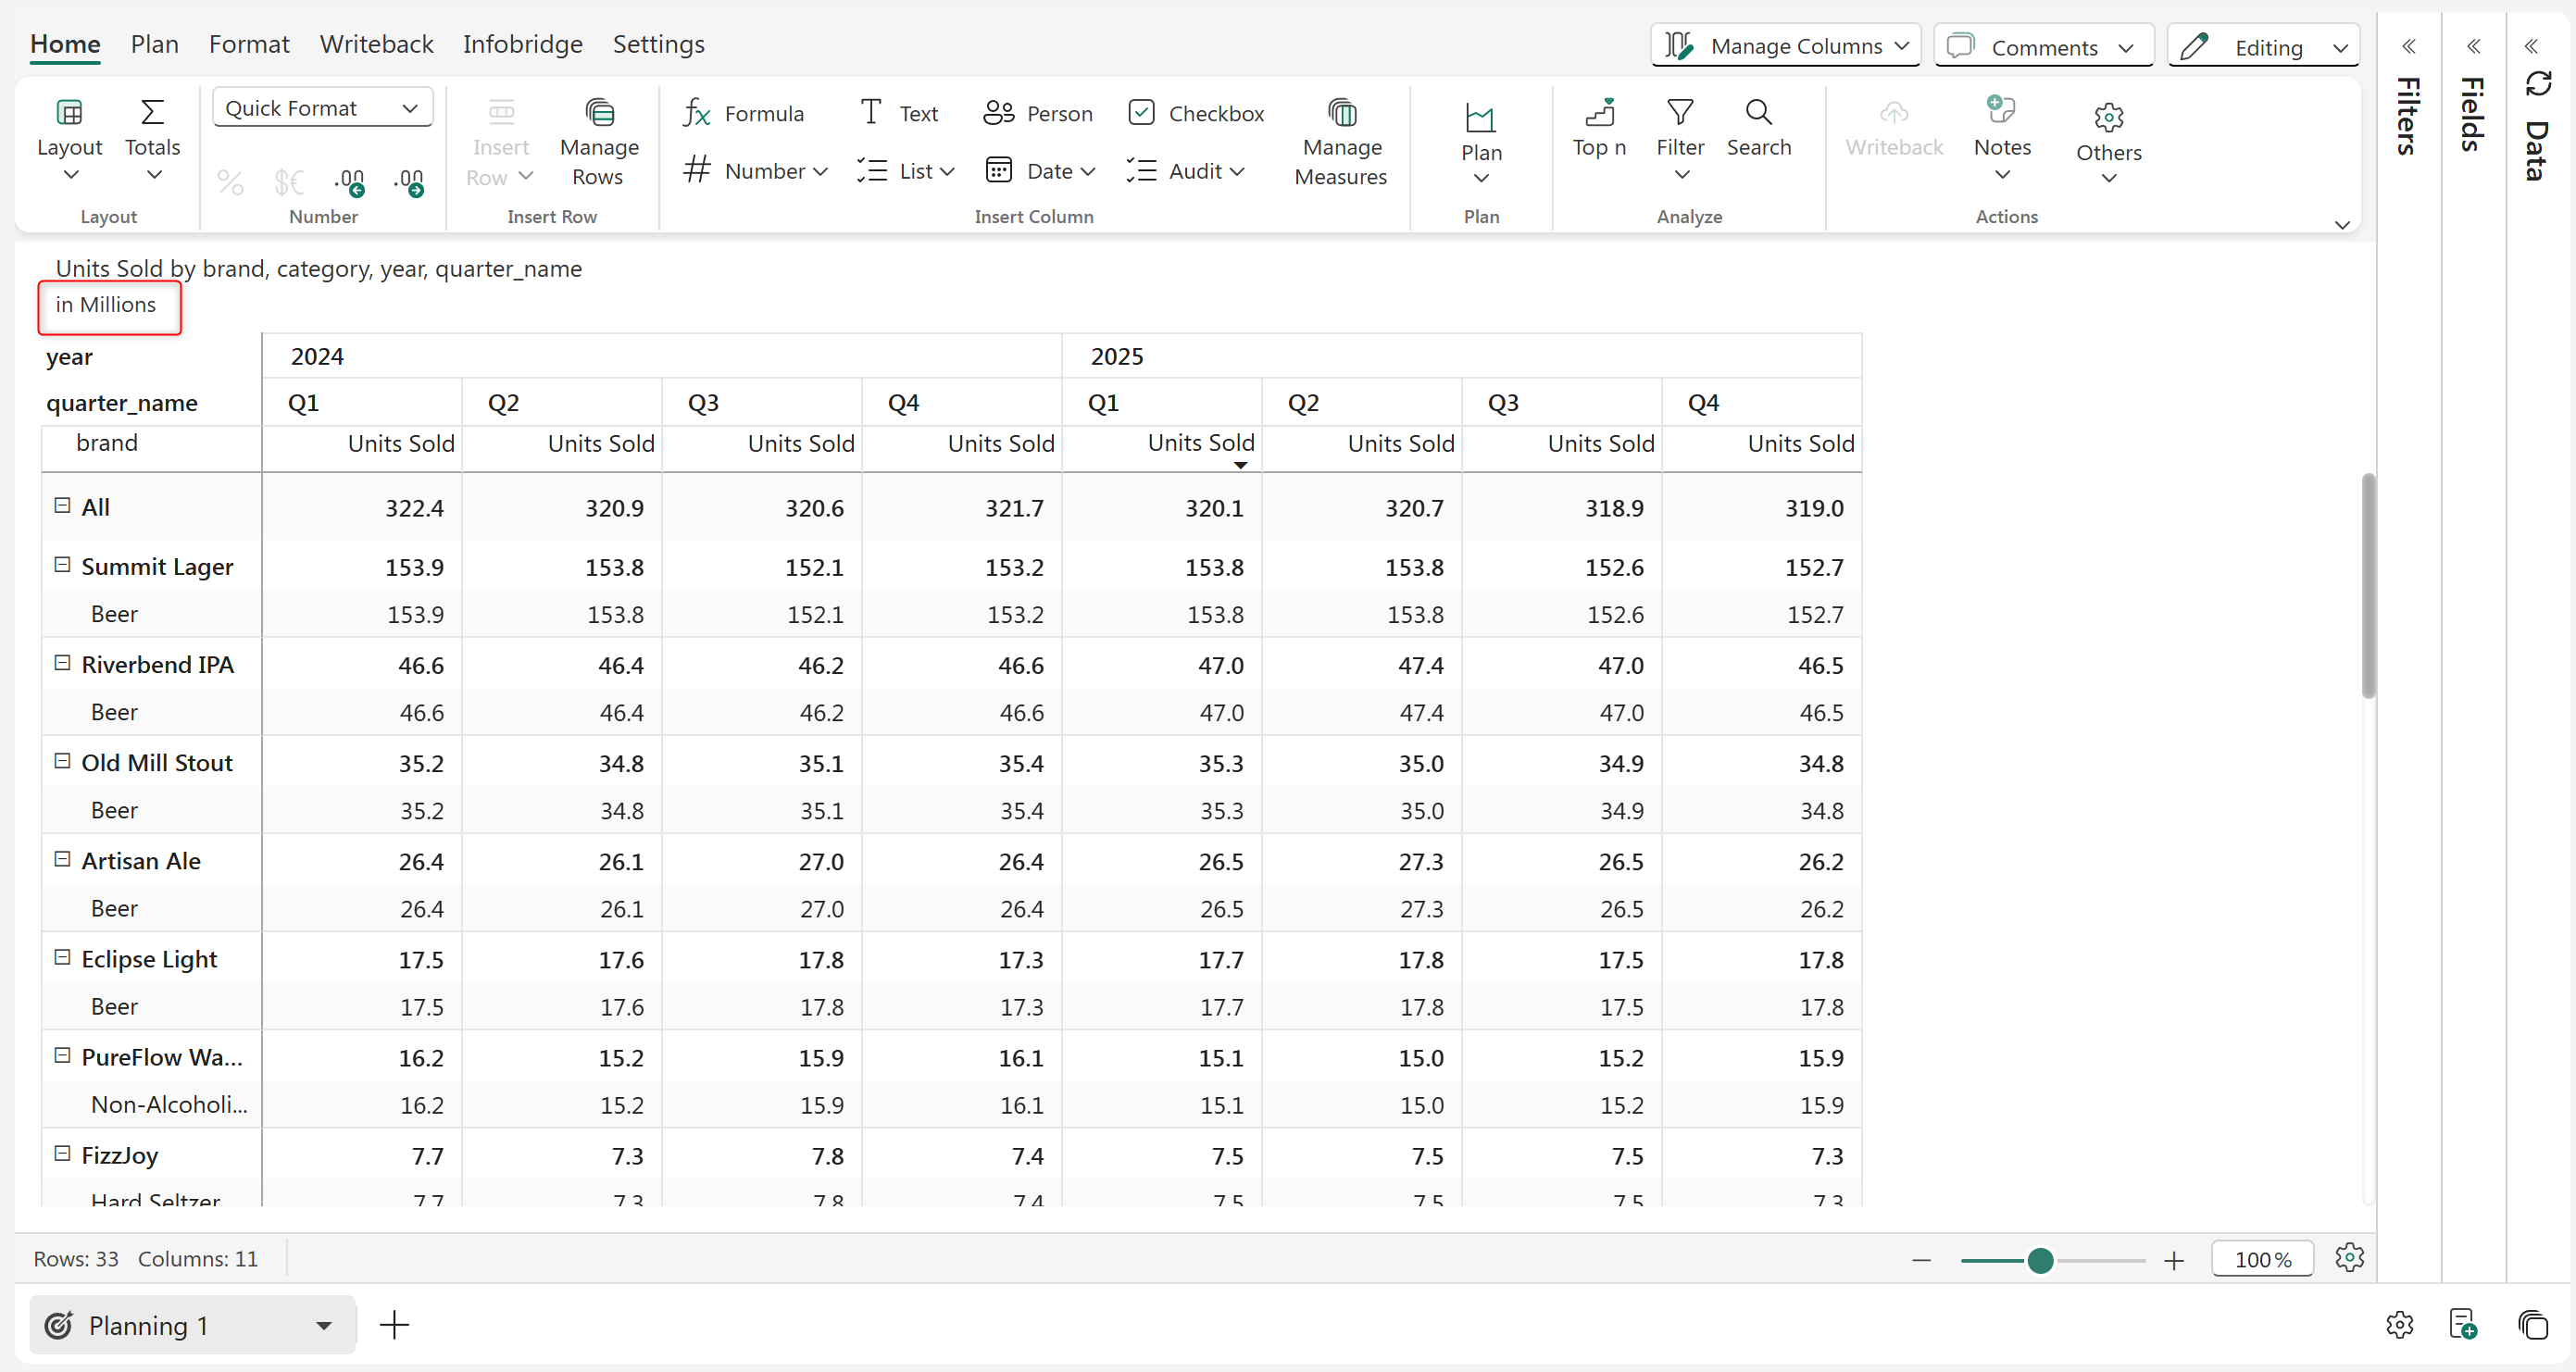
Uniform Scaling
Plan automatically chooses the scaling based on the values. But you can change it if needed. When you expand the Uniform dropdown again, you can see more options from which you can select as needed.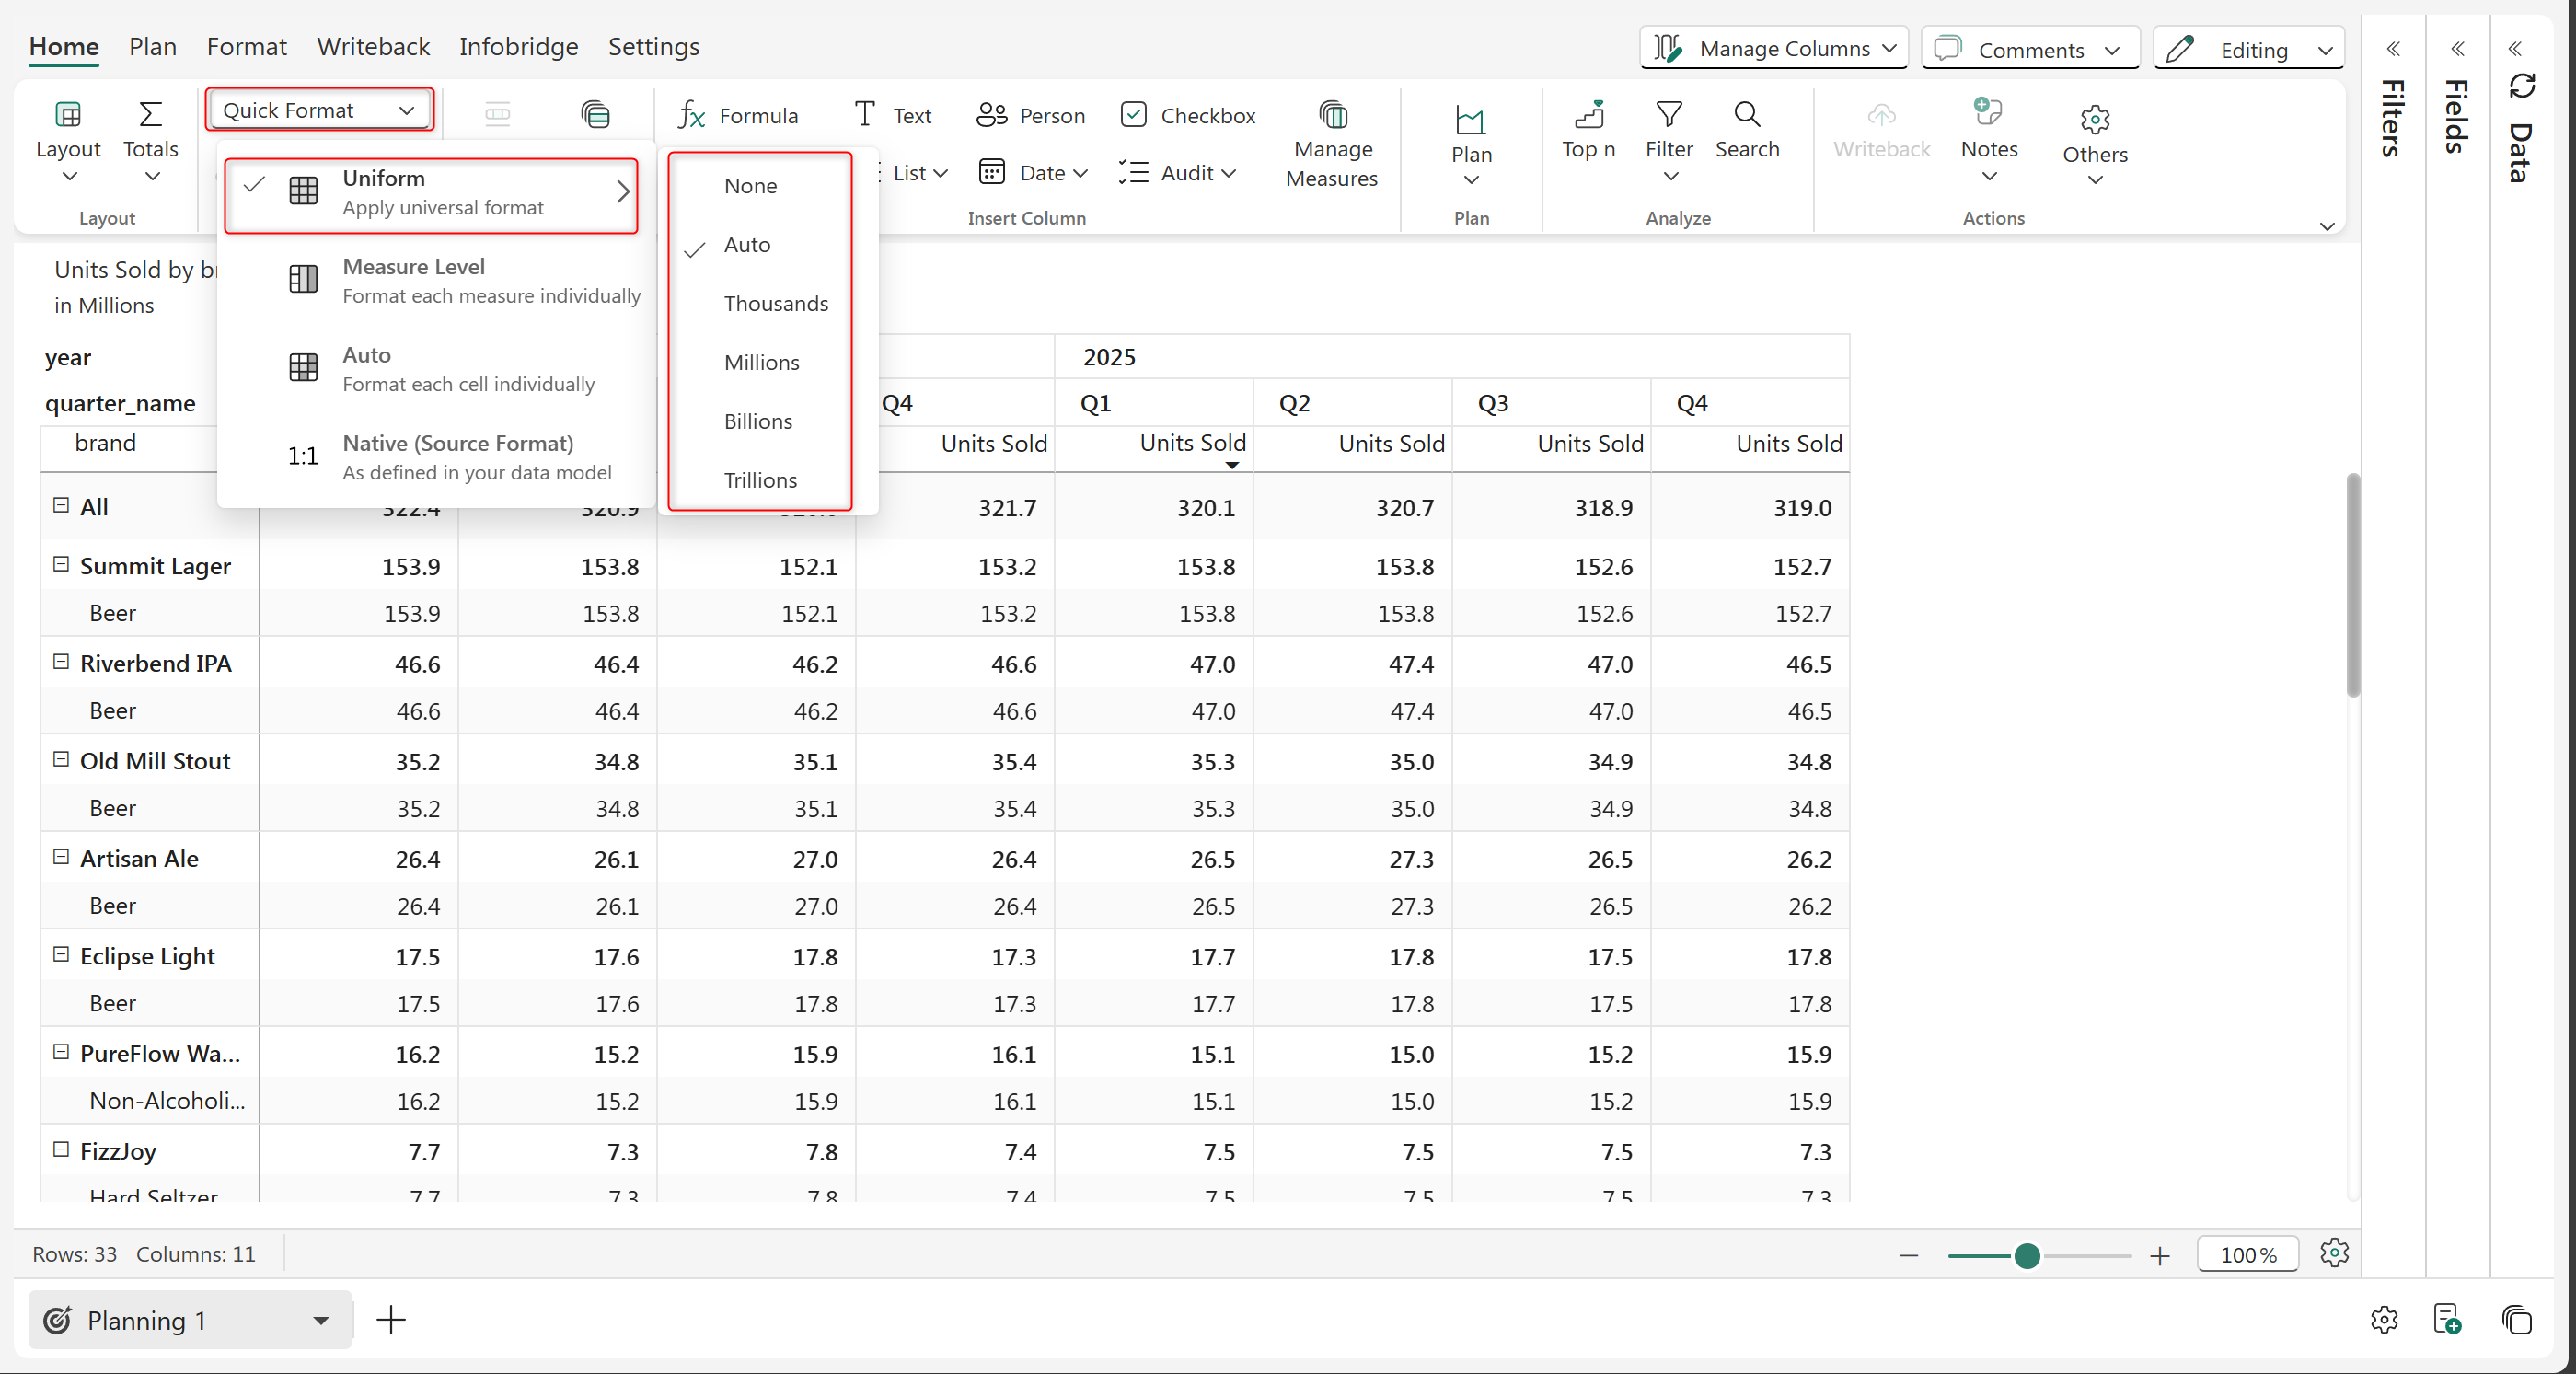
Uniform Options Dropdown
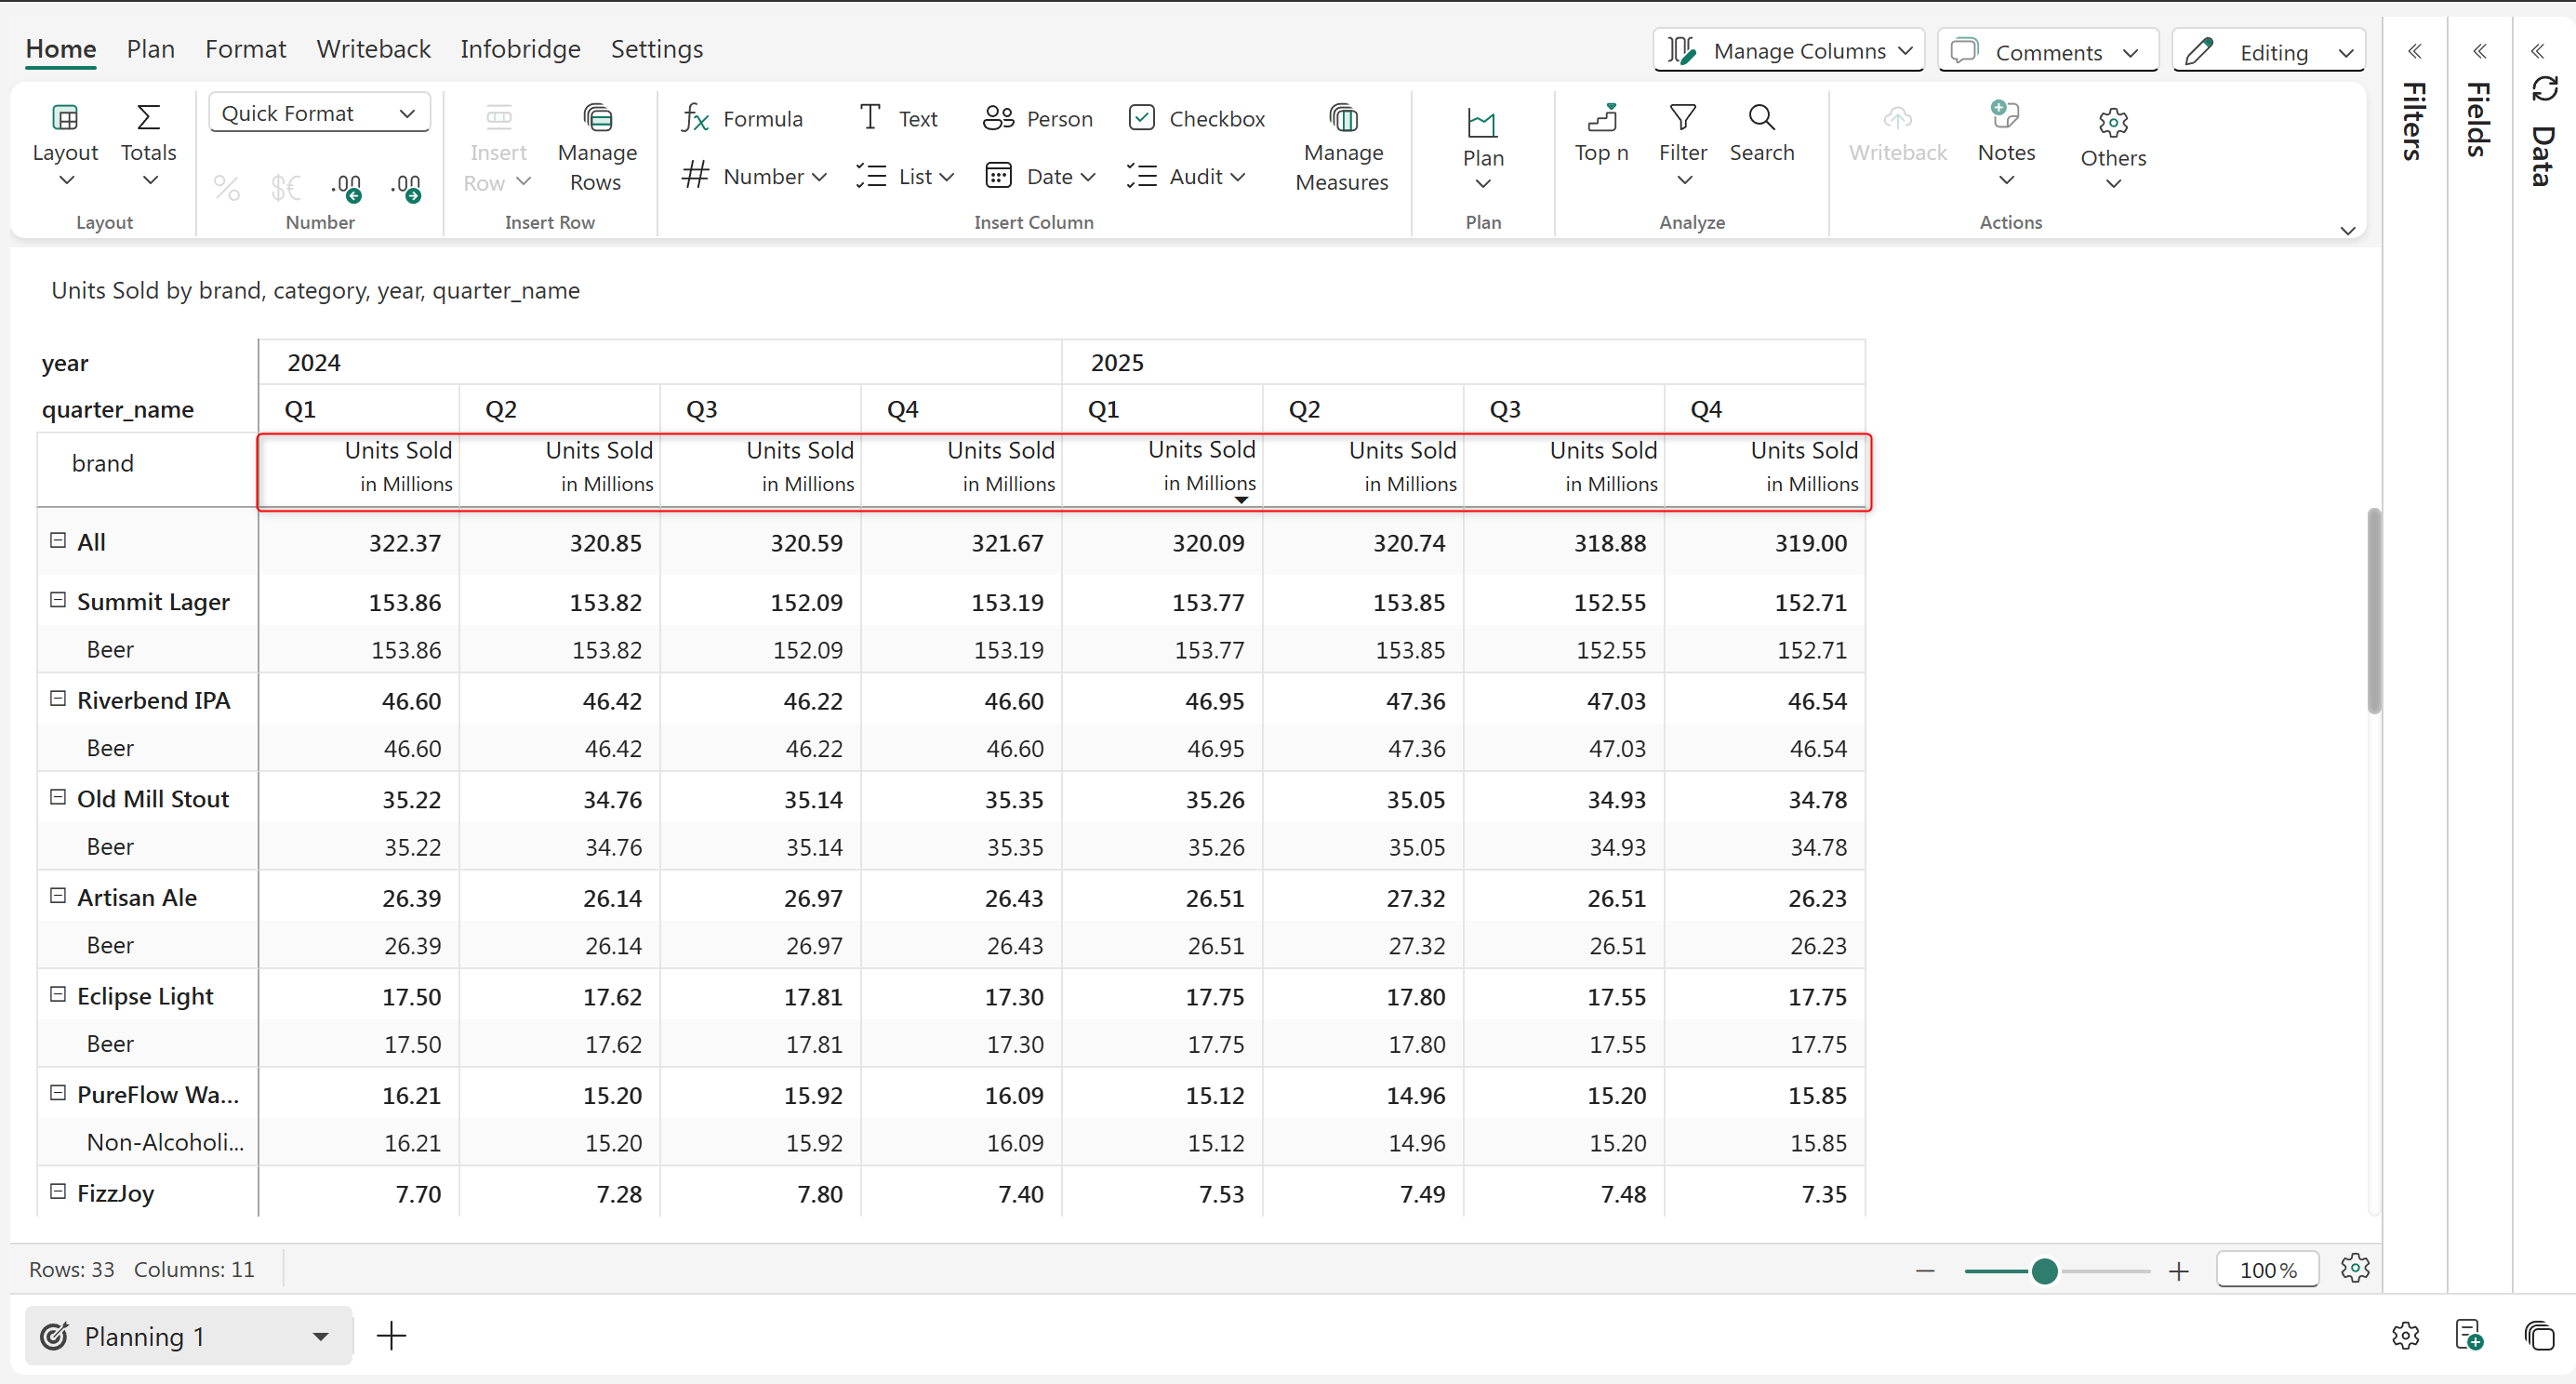
Measure level scaling
### c. Auto scaling When using the 'Auto' option, each cell is formatted individually. suffixes b, m, and k to denote billions, millions, and thousands. In the image below, you can see the - m which denotes millions.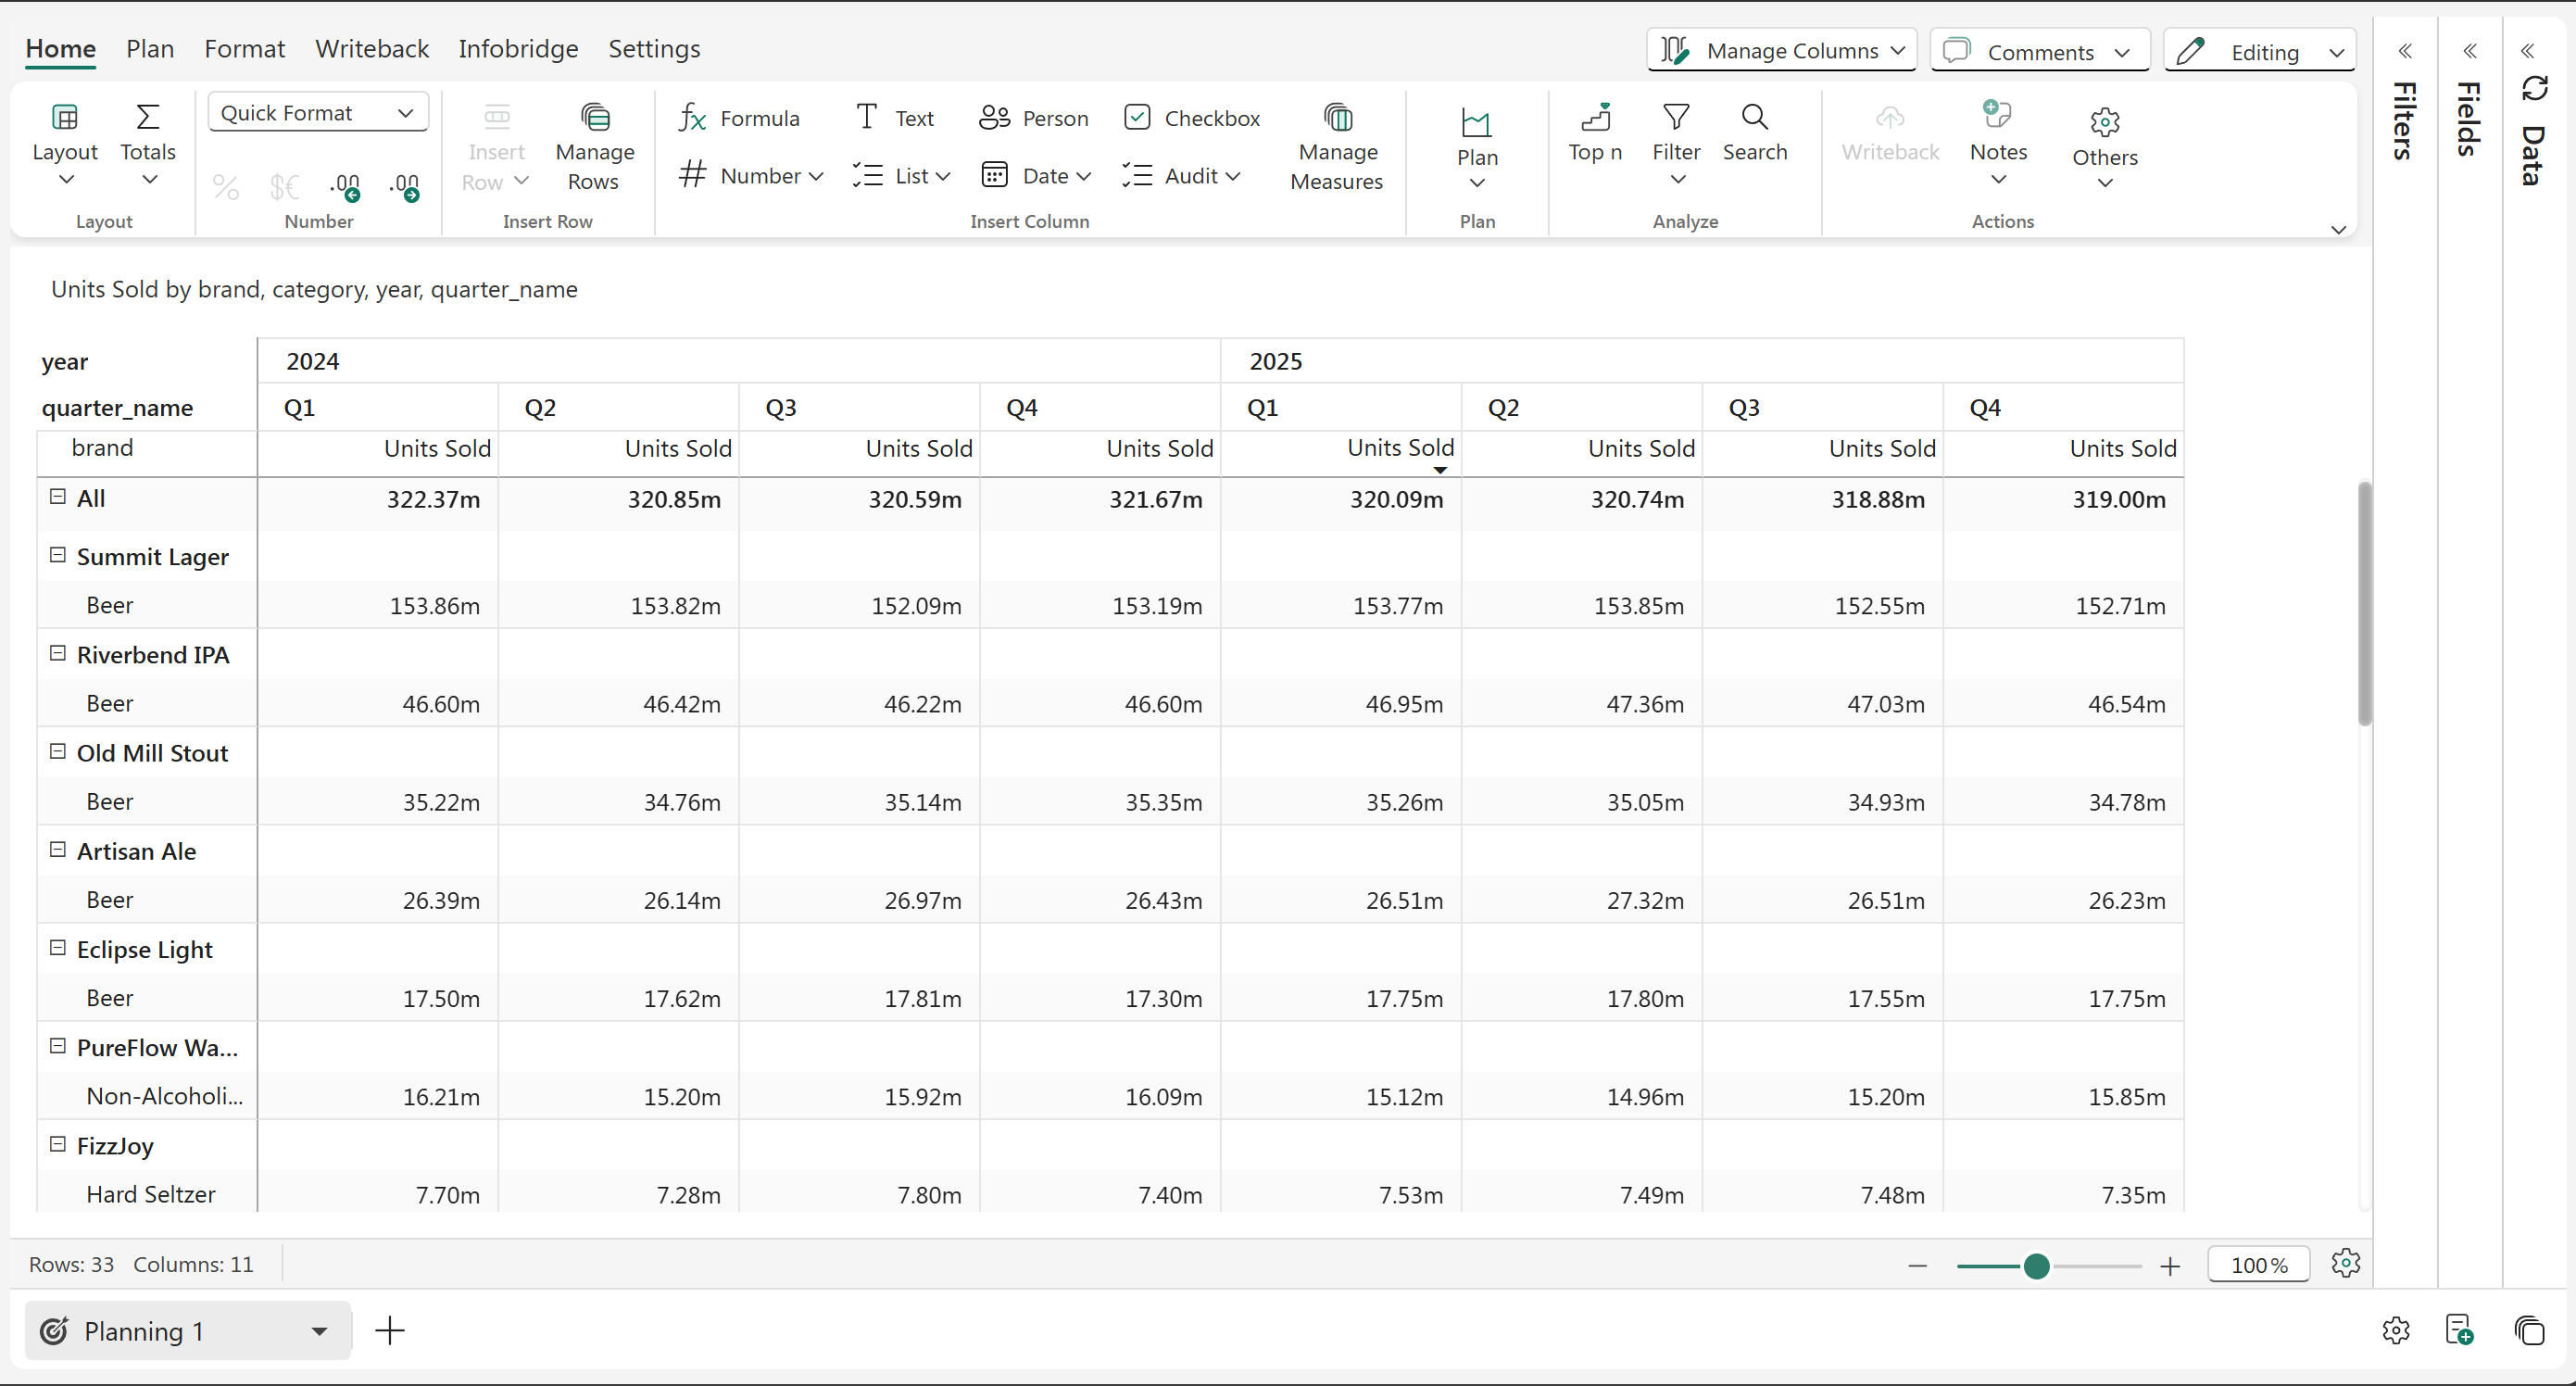
Auto scaling
### d. Native scaling If you do not want any fancy formatting and need the numbers just as they are in the source data, select the ‘Native’ option.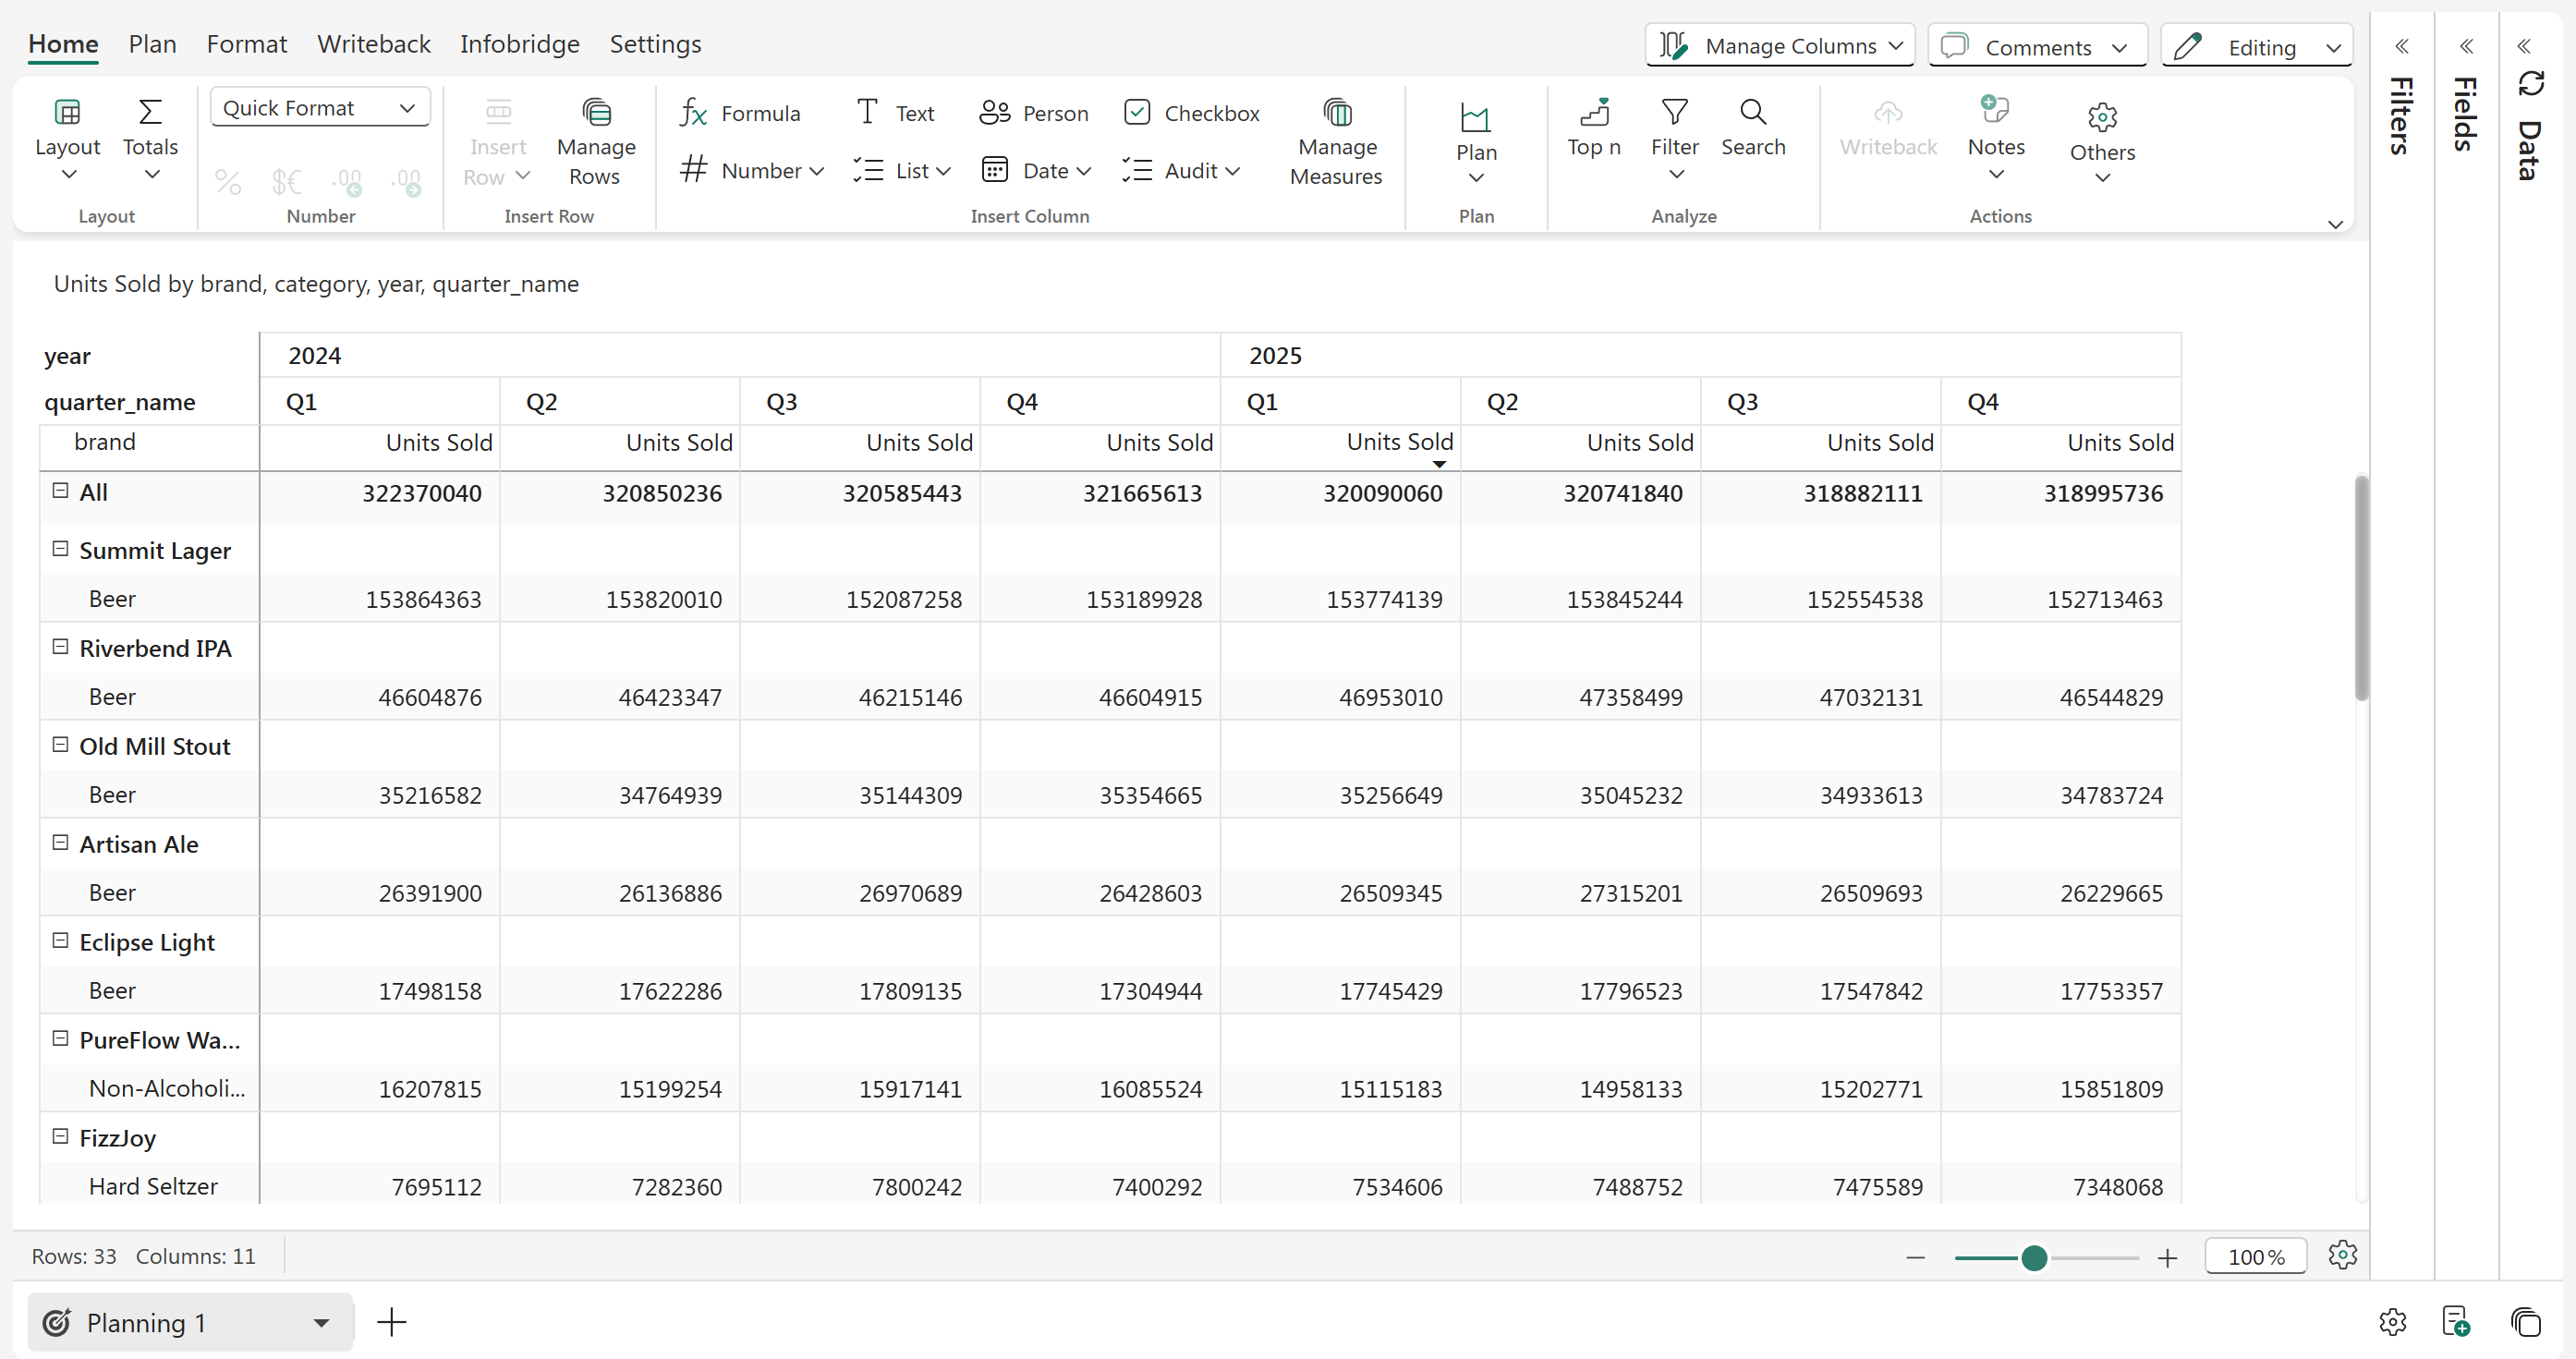
Native scaling
## 2. Percentage, prefix/suffix, and decimals Plan provides options to fine-tune the format at a row, column/measure, or cell level using the icons just below the 'Quick format' dropdown. These options include conversion to % format, attaching prefix/suffix, and increasing/decreasing decimal spaces.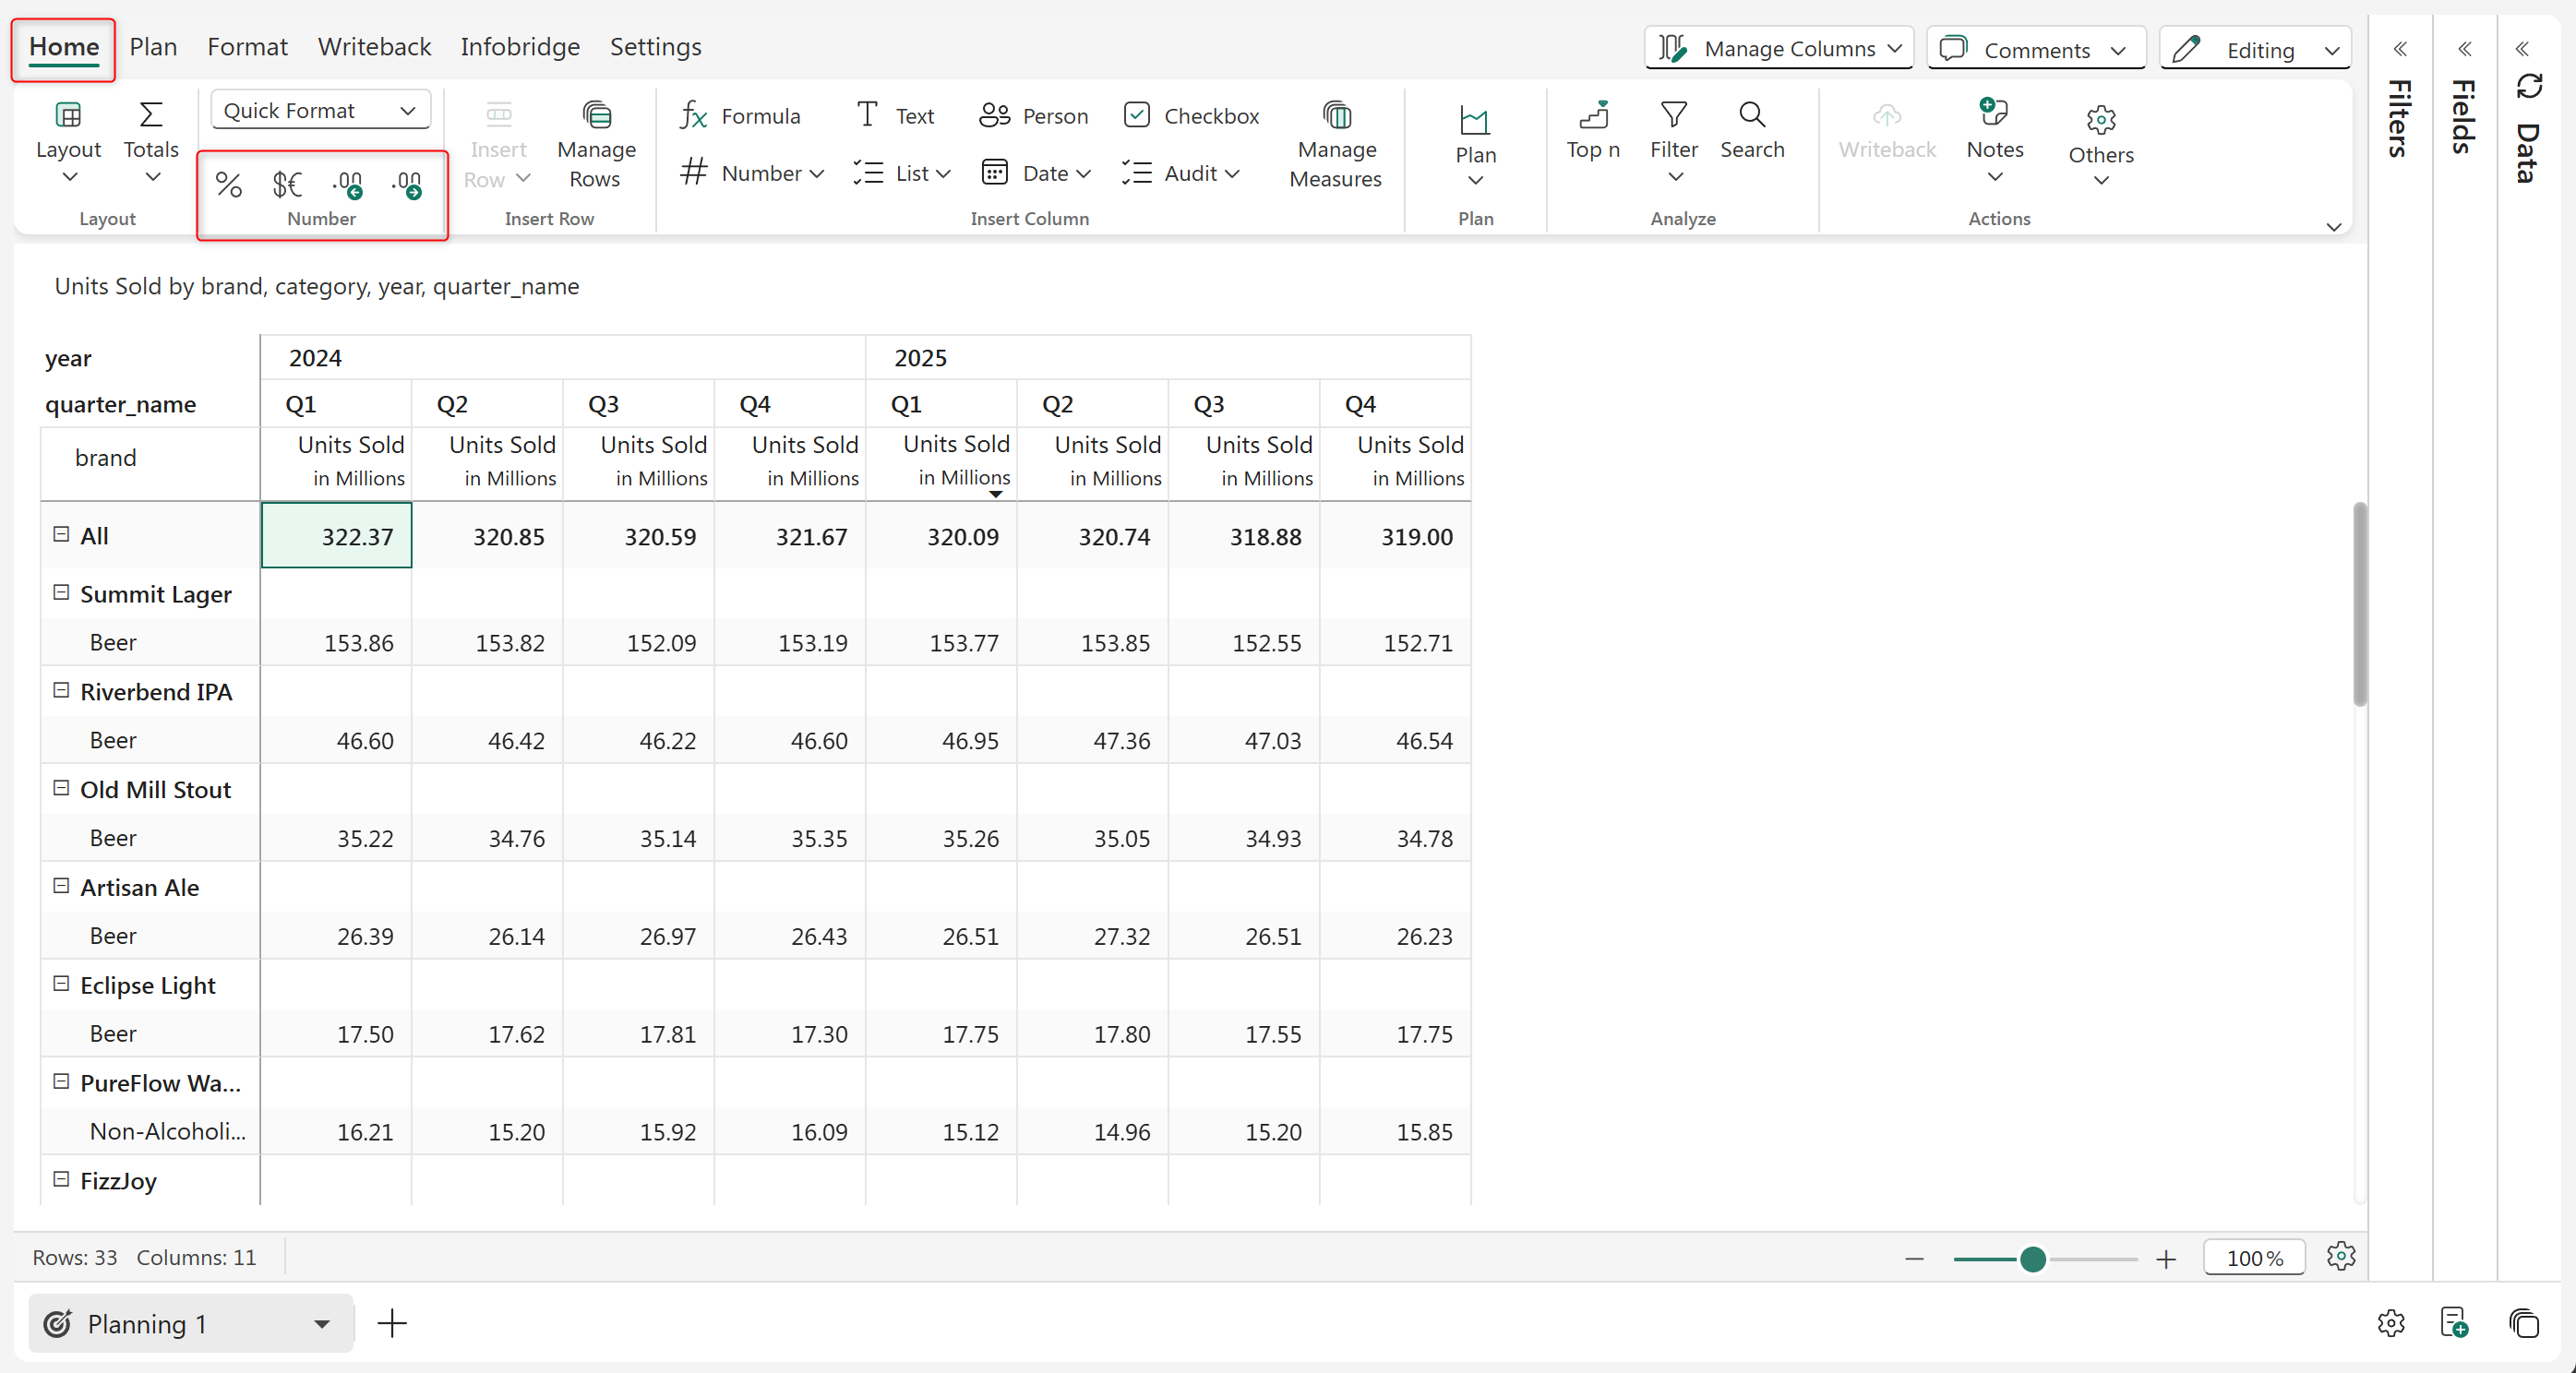
Number formatting options
### a) Percentage You can apply percentage number formatting at the cell level, Row Level or Column Level. To do this, let's select the column or row, or cell the % icon gets enabled. Once you click on the % icon, the values get converted to percentages.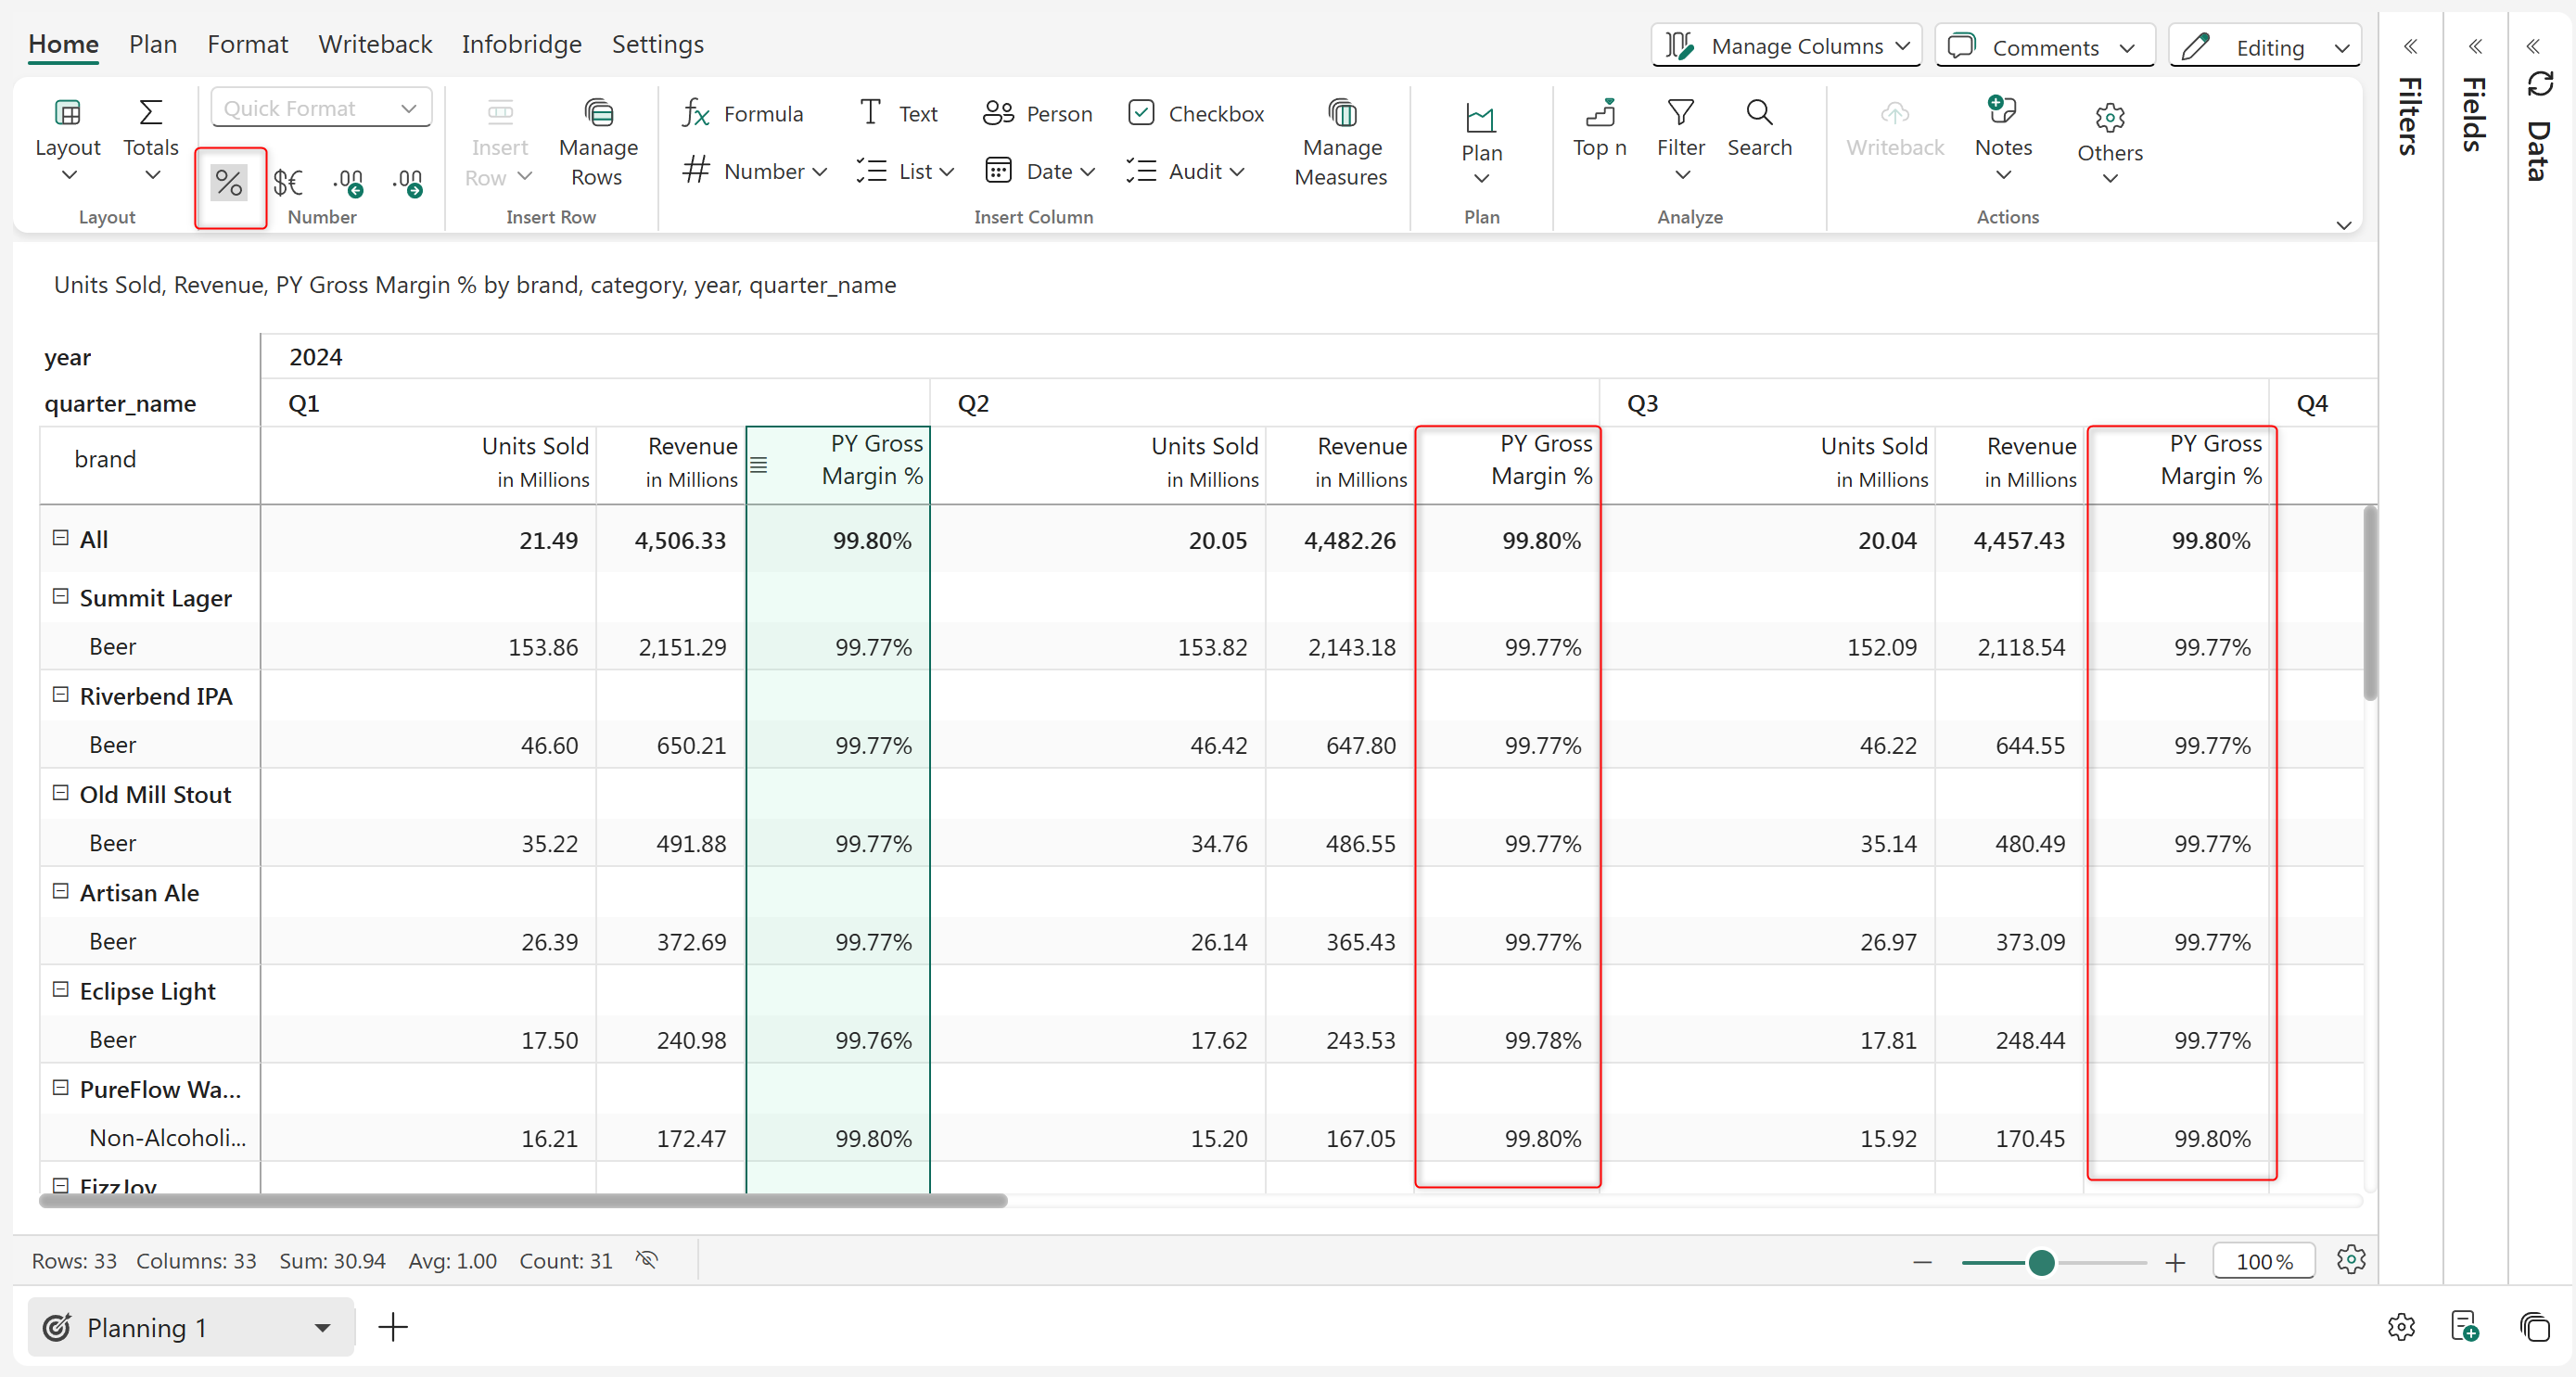
% Number Formatting at Column Level
### b) Prefix/suffix Using Plan, you can insert prefixes such as currency or suffixes like units. In the example below, the price is $ per unit. Select the column, row, or cell and click on the highlighted $~~C~~ icon. Enter the prefix and suffix as shown and apply. Now the prefix and suffix are added.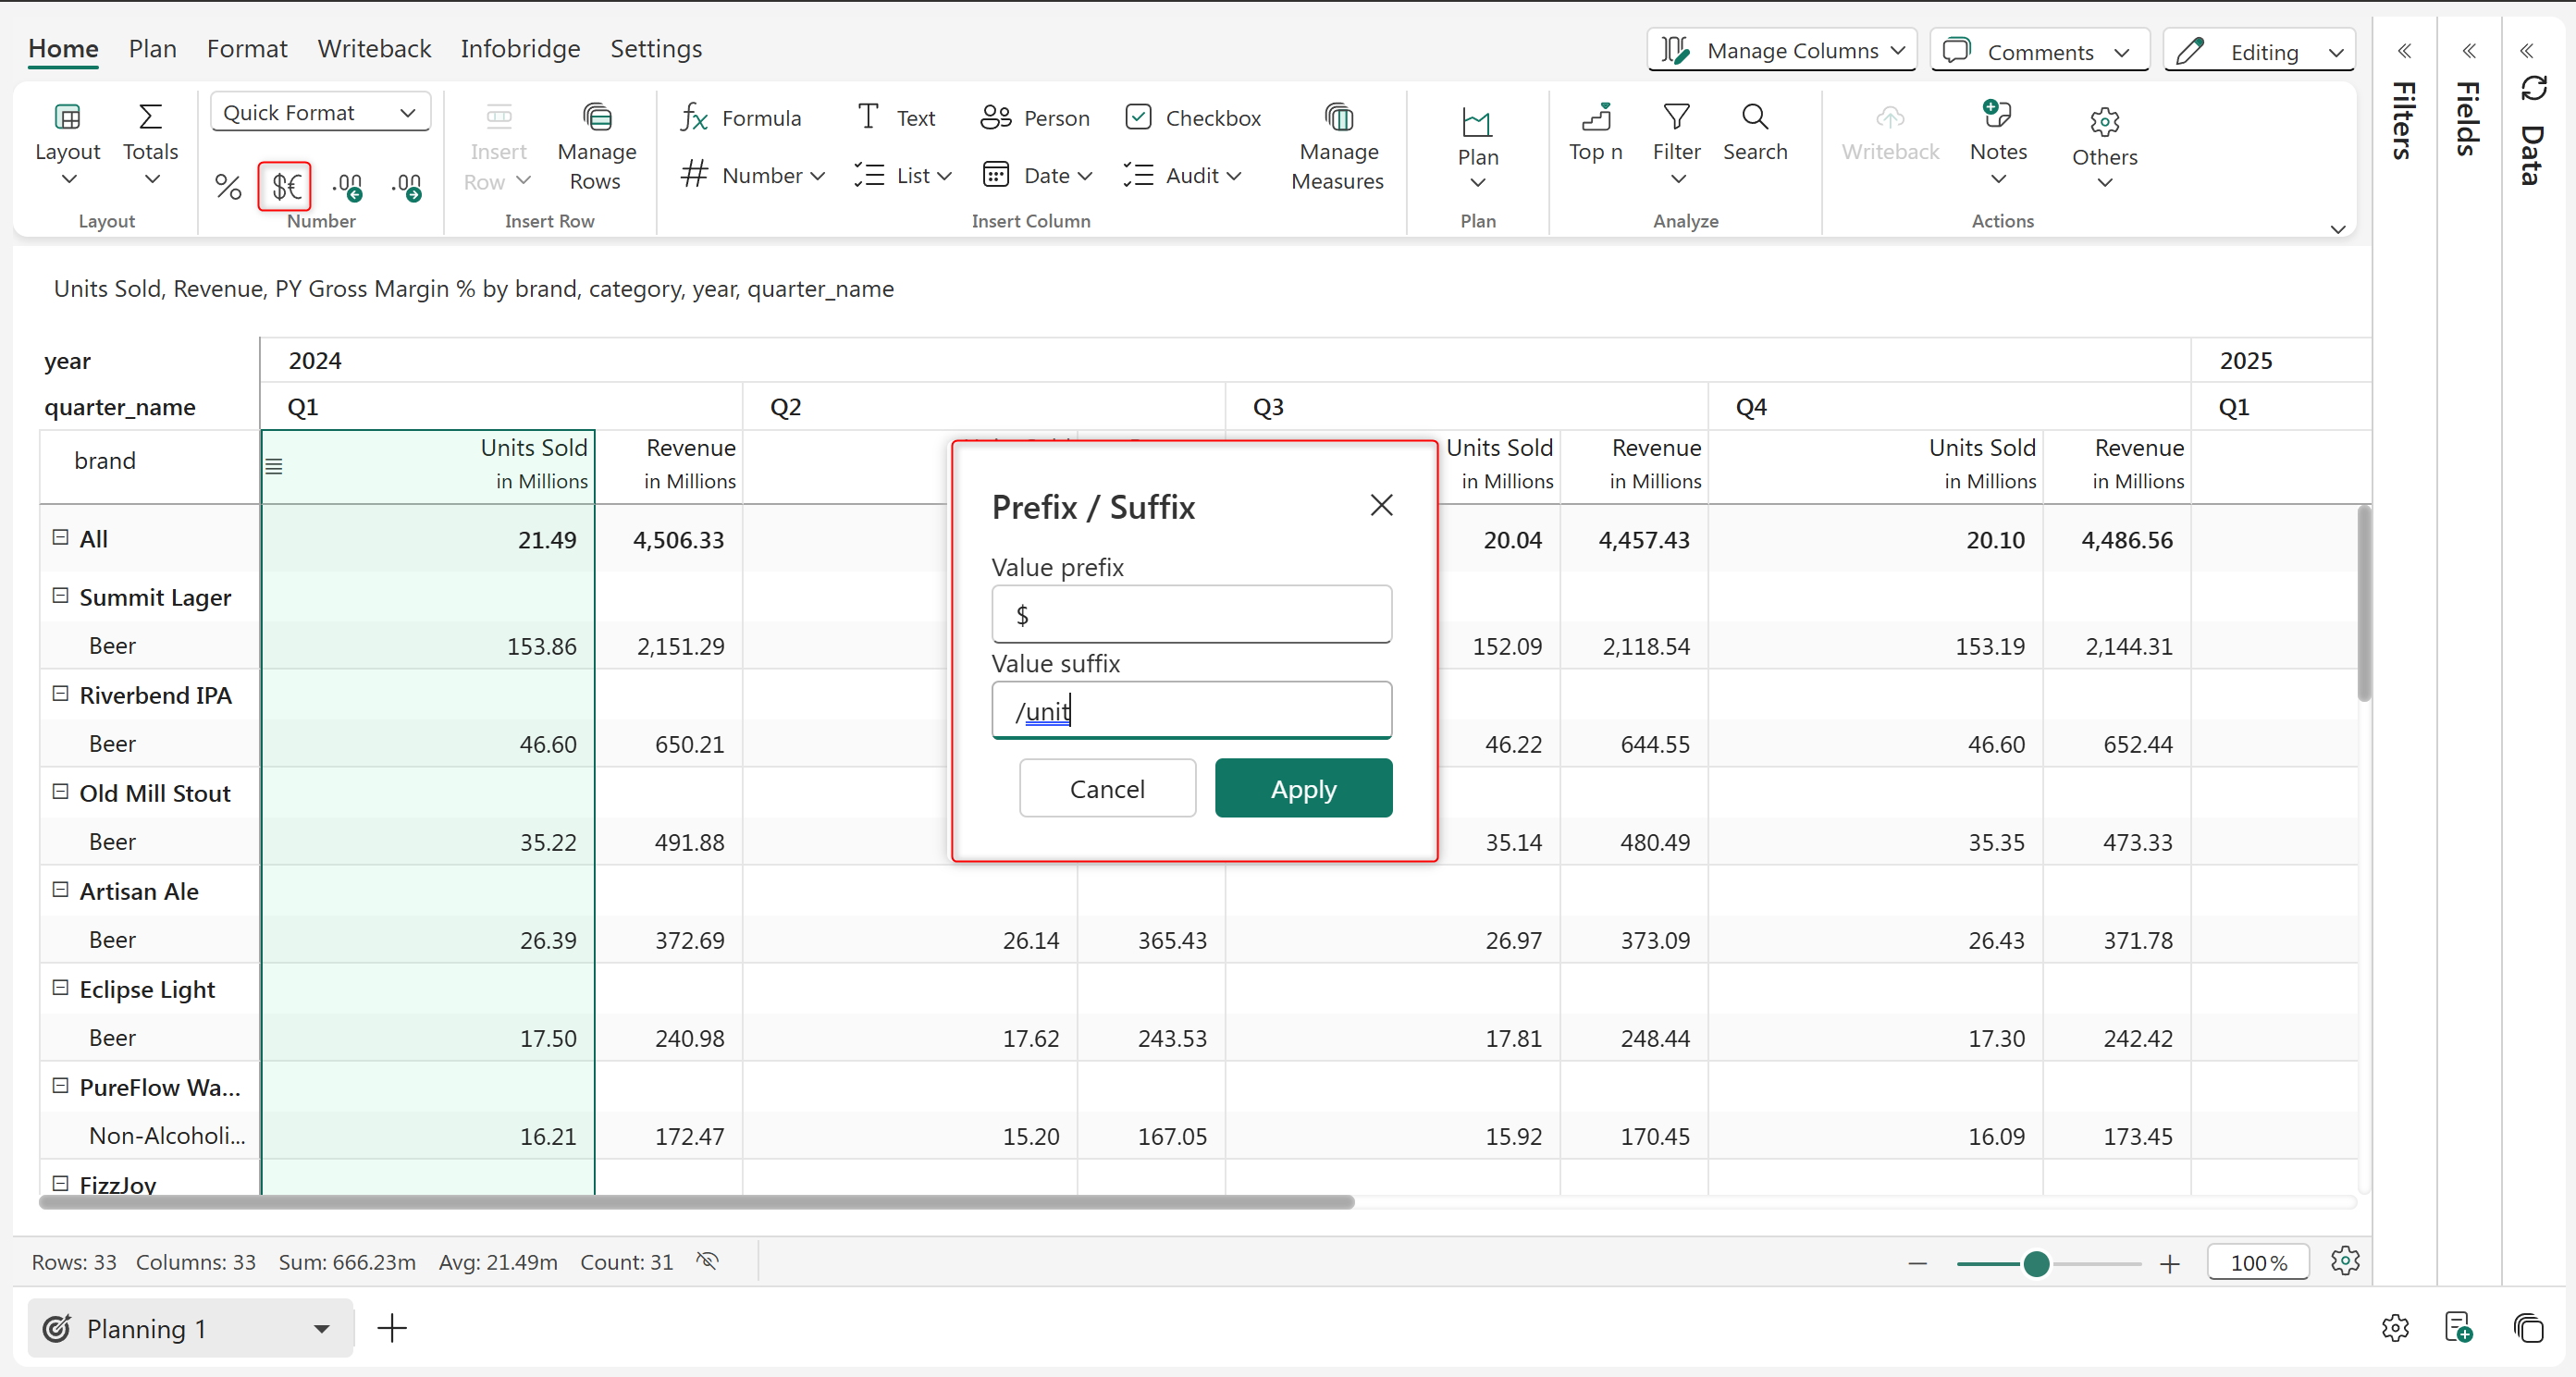
Prefix and Suffix pop-up
Click Apply to see the changes.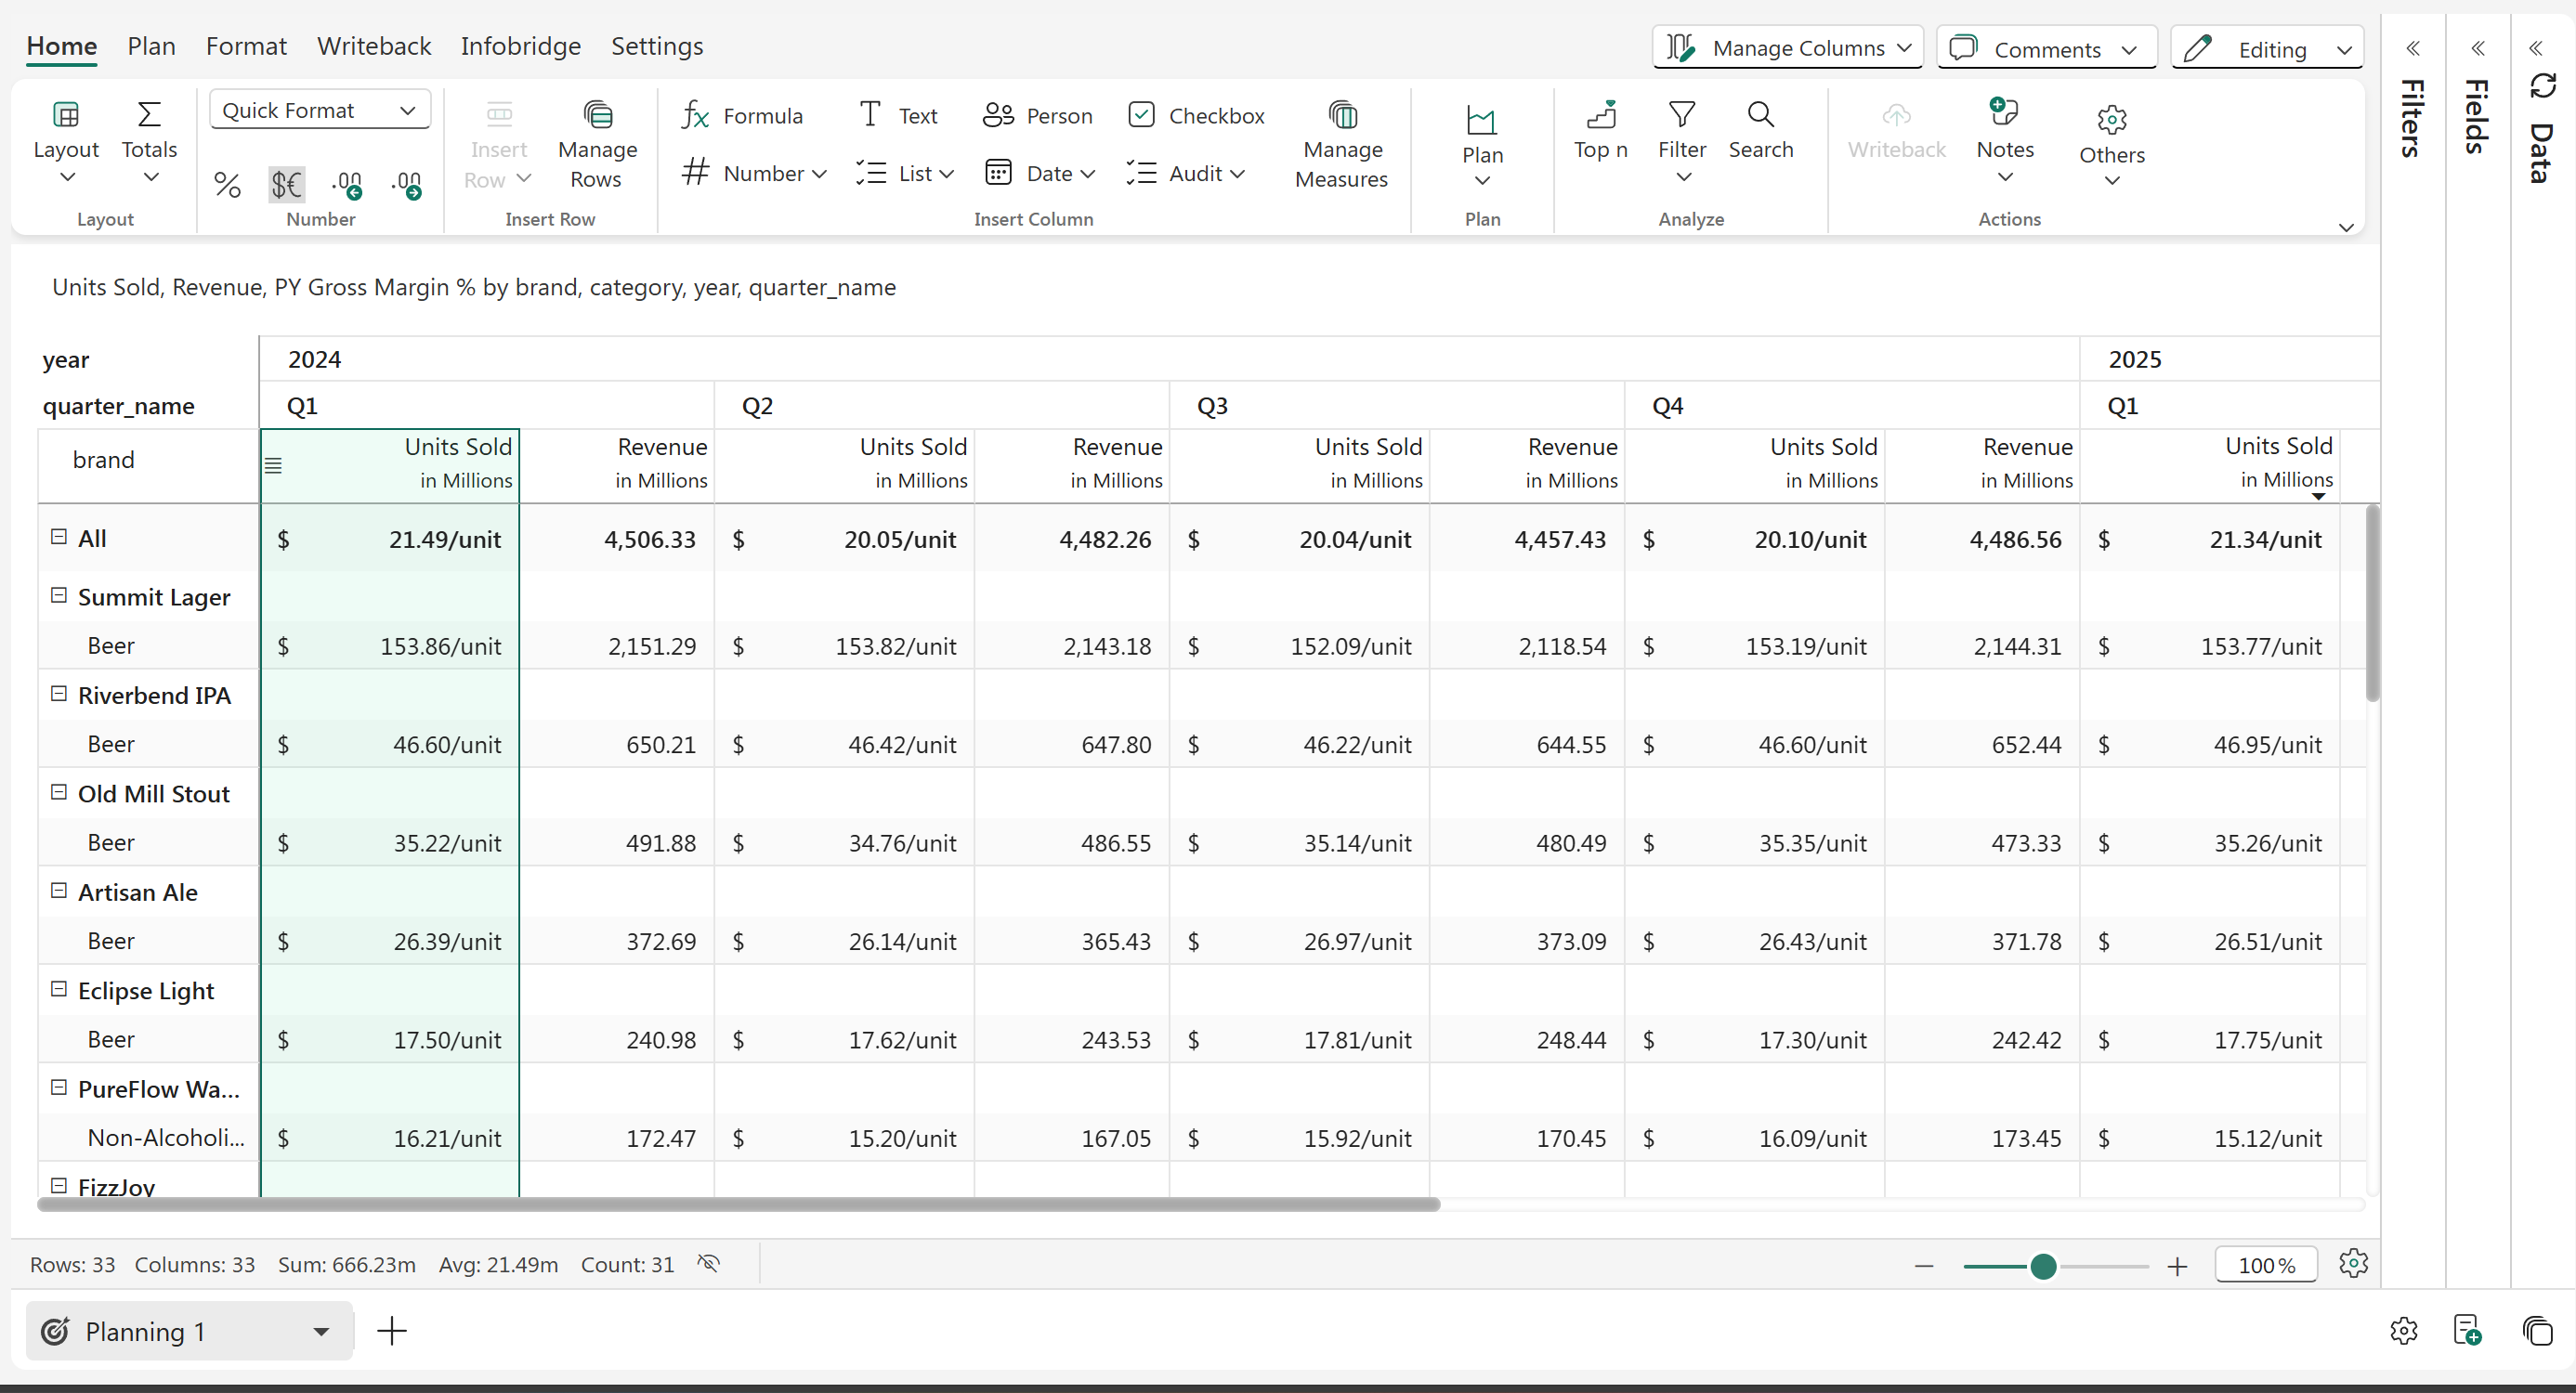
$ prefixed and /unit suffixed
### c) Decimals You can increase or decrease decimal places at a cell/row/column level by selecting the cell/row/column and clicking on the 'Increase decimal' option to increase or 'Decrease decimal' icon to decrease the decimal places. In the image below, the decimal places of the Unit sold column are decreased, while those of the Revenue column are increased.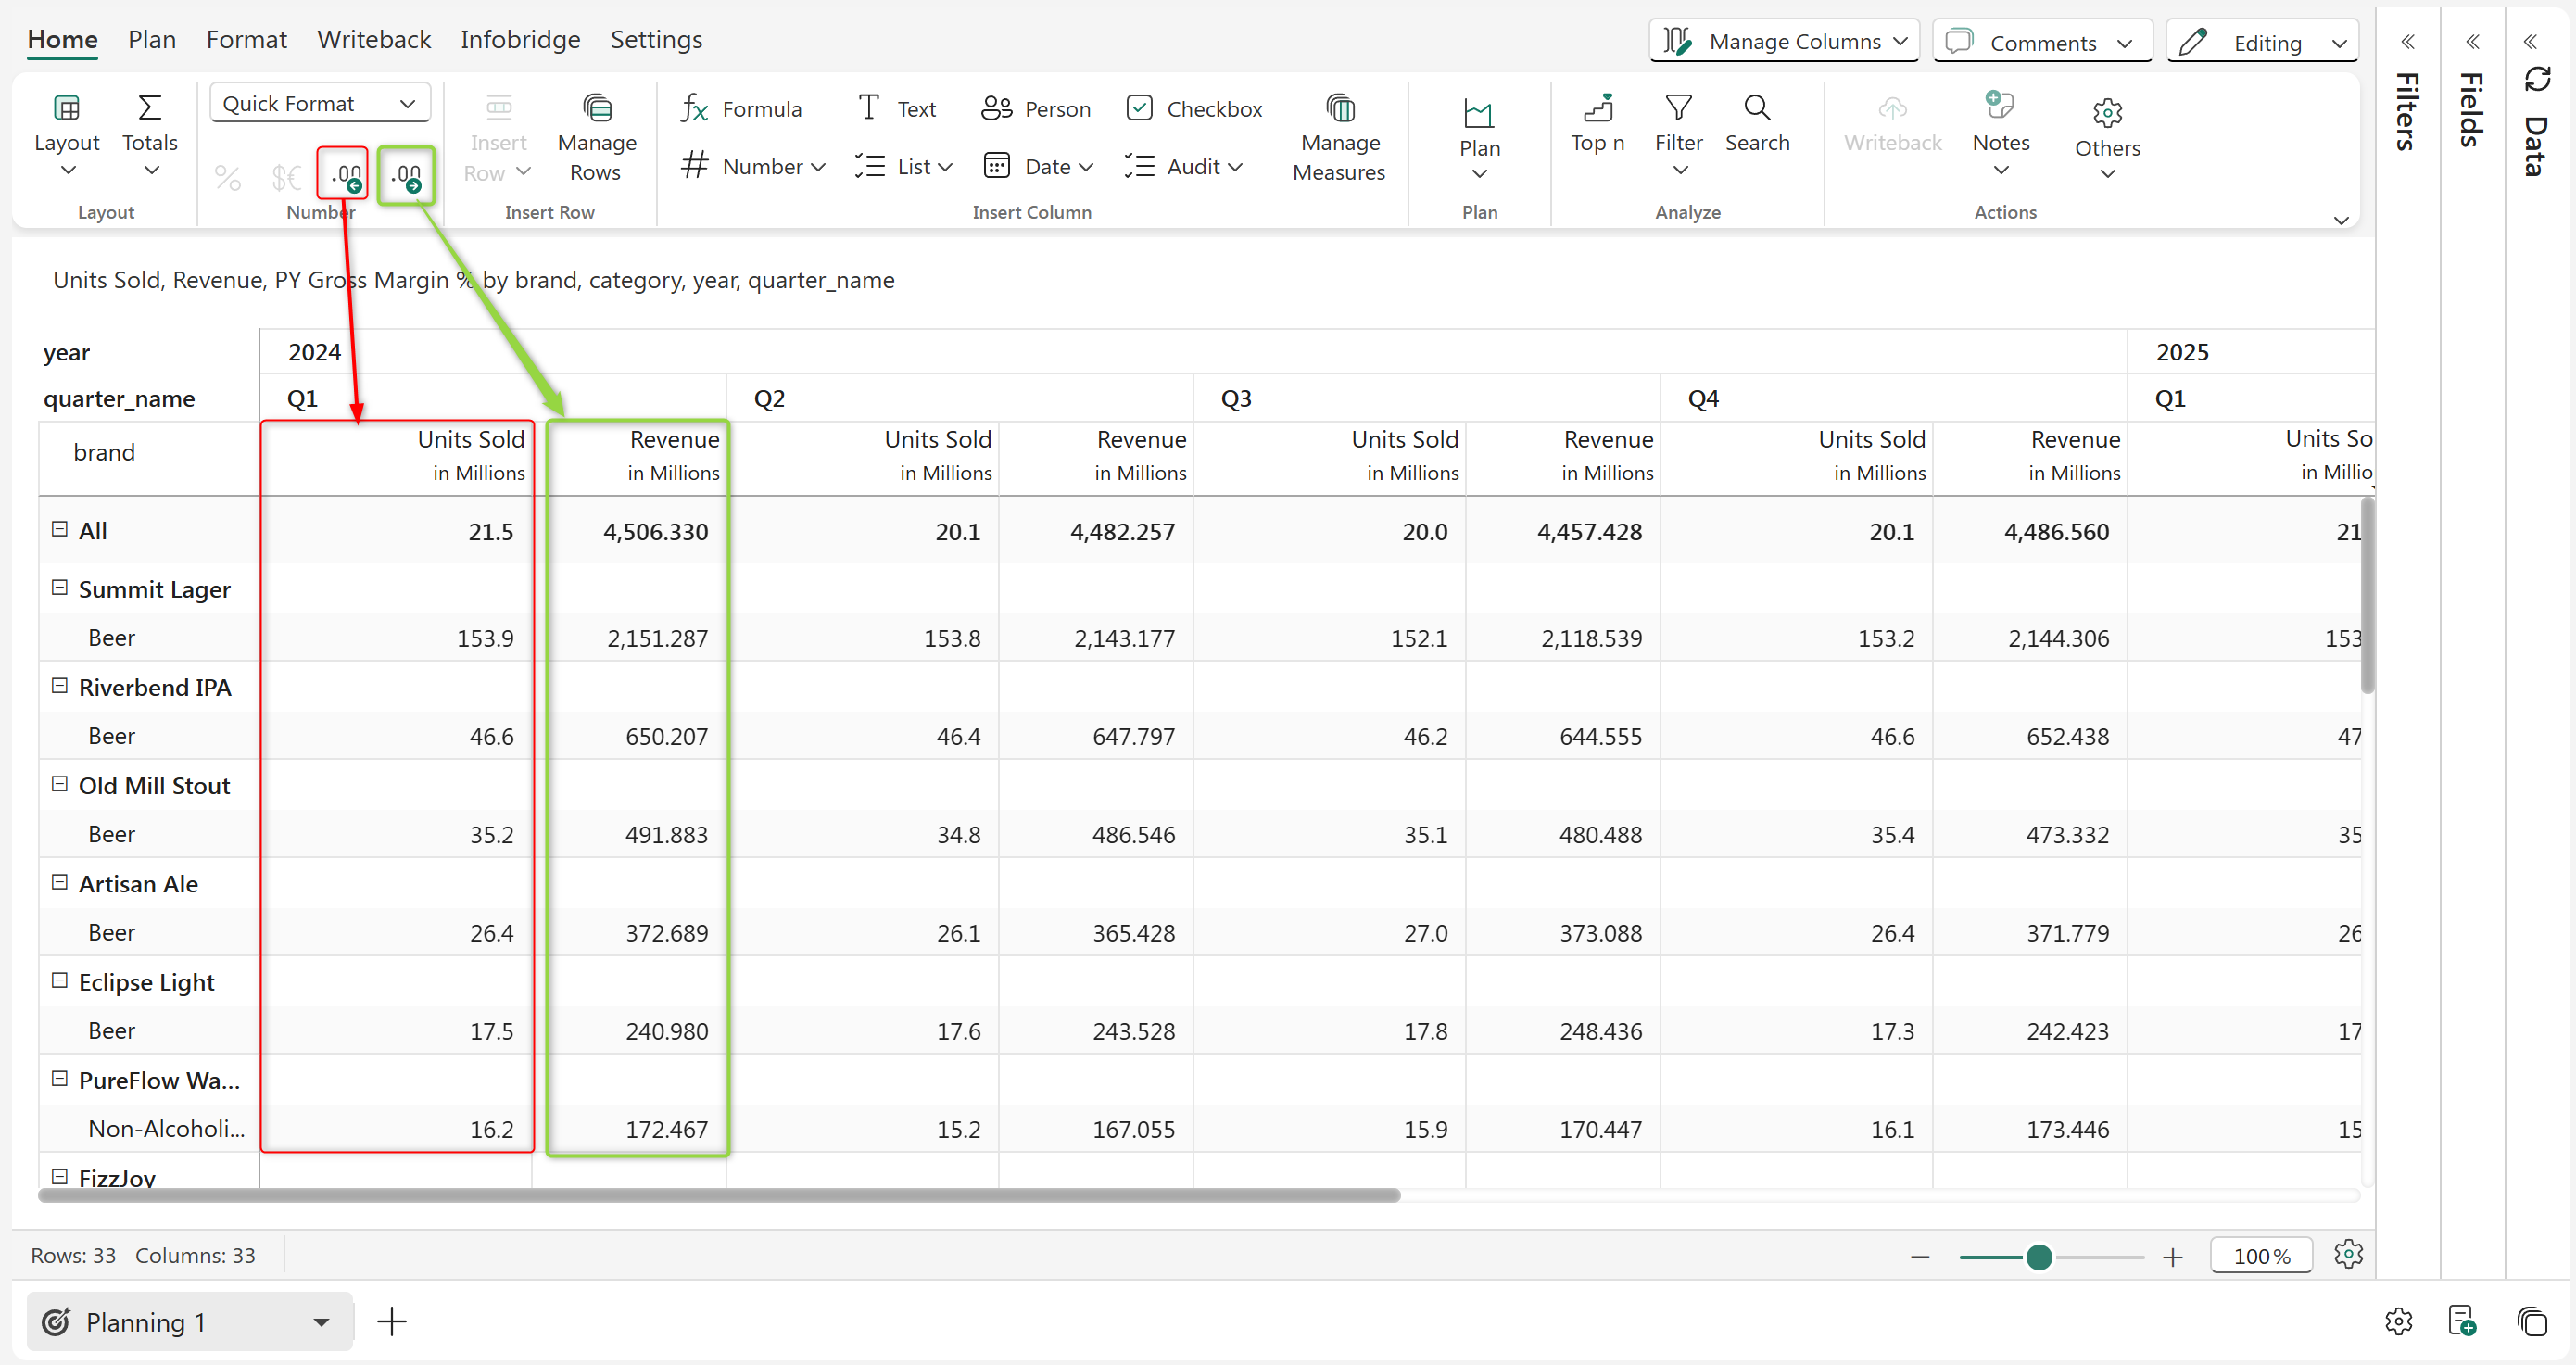
The Decimal increase and decimal decrease options are shown.
### 3. Semantic formatting Plan provides a number of options to customize numbers. In the 'Settings' tab, click on the 'Appearance' settings. In the 'Numbers' tab, you'll find options such as Semantic formatting, Value display, Sign, and more. In this section, let's talk about semantic formatting. You can see the positive and negative options on enabling the toggle, as shown below. By default, they are shown in green and red, but they can be customized using the color picker.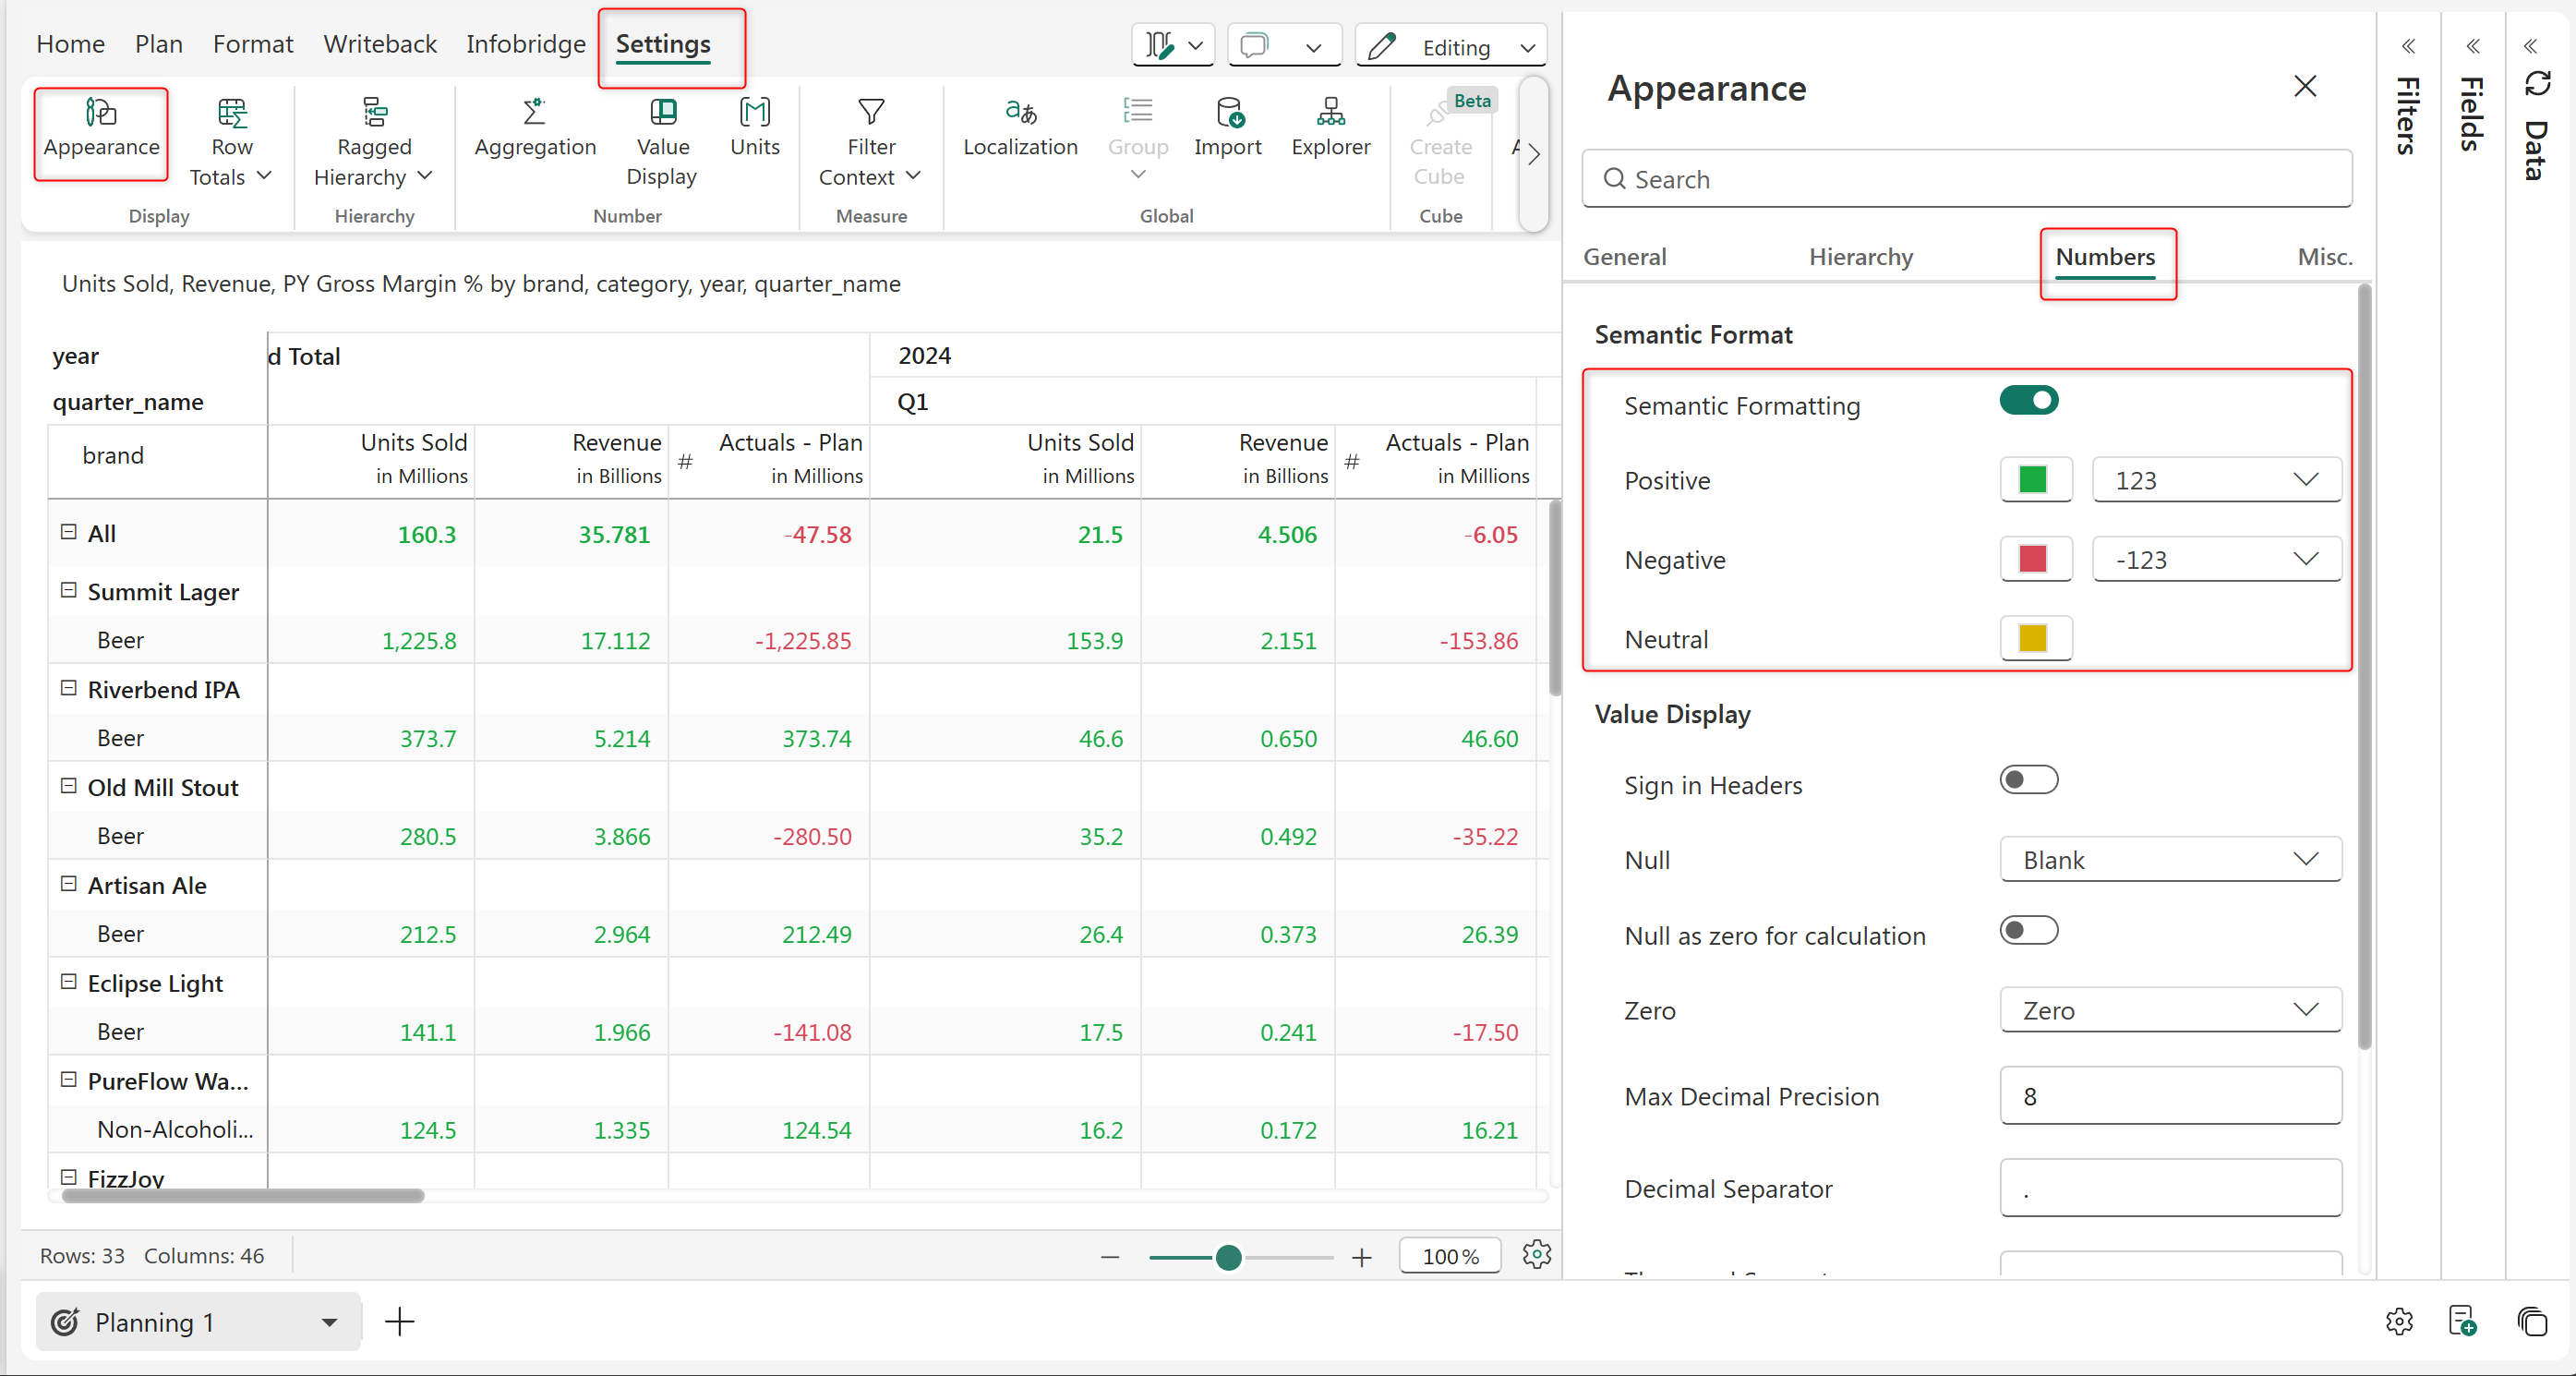
Semantic Formatting of Numbers
Negative Numbers and Positive Number Formatting Options
--- # Agent Instructions This documentation is published with GitBook. GitBook is the documentation platform designed so that both humans and AI agents can read, navigate, and reason over technical content effectively. Learn more at gitbook.com. ## Querying This Documentation If you need additional information that is not directly available in this page, you can query the documentation dynamically by asking a question. Perform an HTTP GET request on the current page URL with the `ask` query parameter, and the optional `goal` query parameter: ``` GET https://docs.fabricplan.com/planning-sheets/how-tos/basic-formatting/number-formatting.md?ask=