# Cell, header & value formatting

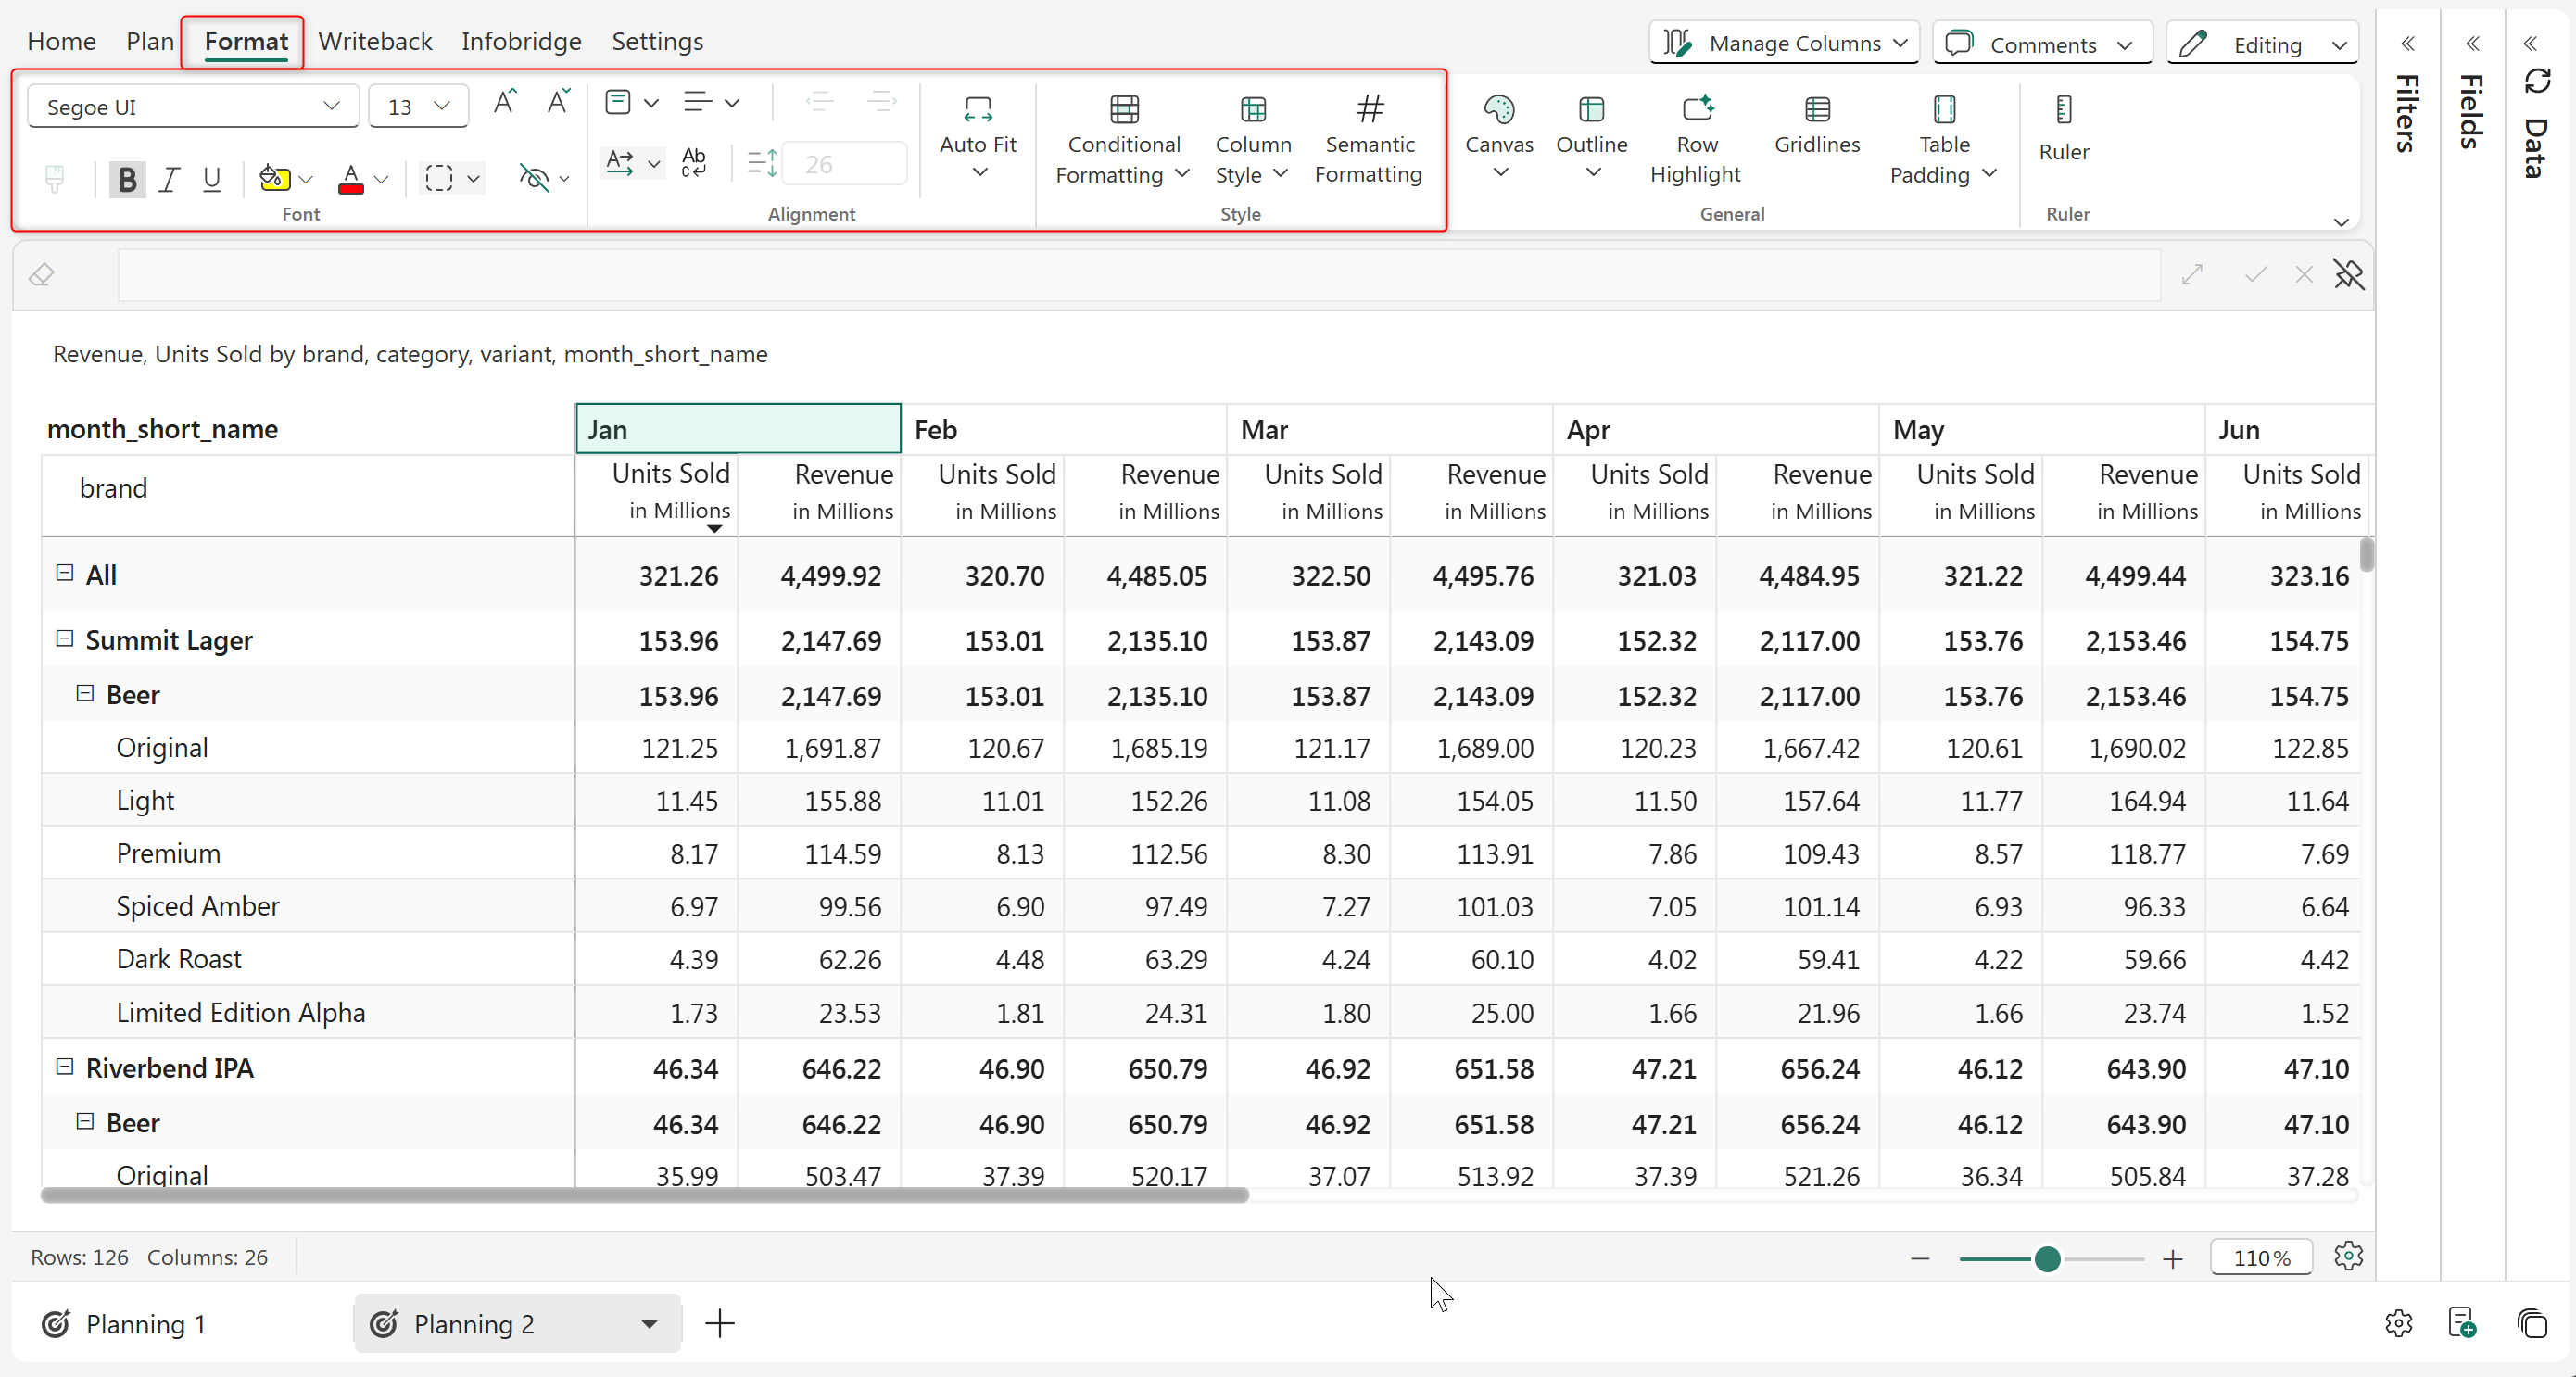
In **Plan**, you can customize the appearance of cell content by adjusting **font color**, **style**, **size**, and **text alignment**, as well as applying additional **formatting effects**. All of these options are conveniently accessible from the **Format** tab on the toolbar, within the **Font** and **Alignment** sections. This allows you to tailor the presentation of your data for improved readability and visual consistency.

<figure><img src="/files/EOSBC4vsqZJQez7zleXR" alt=""><figcaption></figcaption></figure>

<figure><img src="https://github.com/lumelinc/PowerTableDocs/blob/main/.gitbook/assets/image%20(1295).png" alt=""><figcaption><p>Style and alignment sections</p></figcaption></figure>

## 1. Style options

Let's take a look at the style section.

#### a) Font and size

The default font is Inforiver Sans which has been specifically designed for use in financial and tabular reports. But you can change to a different font from the dropdown menu and change the default size.

#### b) Increase/decrease font size

Font size can also be changed by using the Increase/Decrease font size options.

#### c) Font style

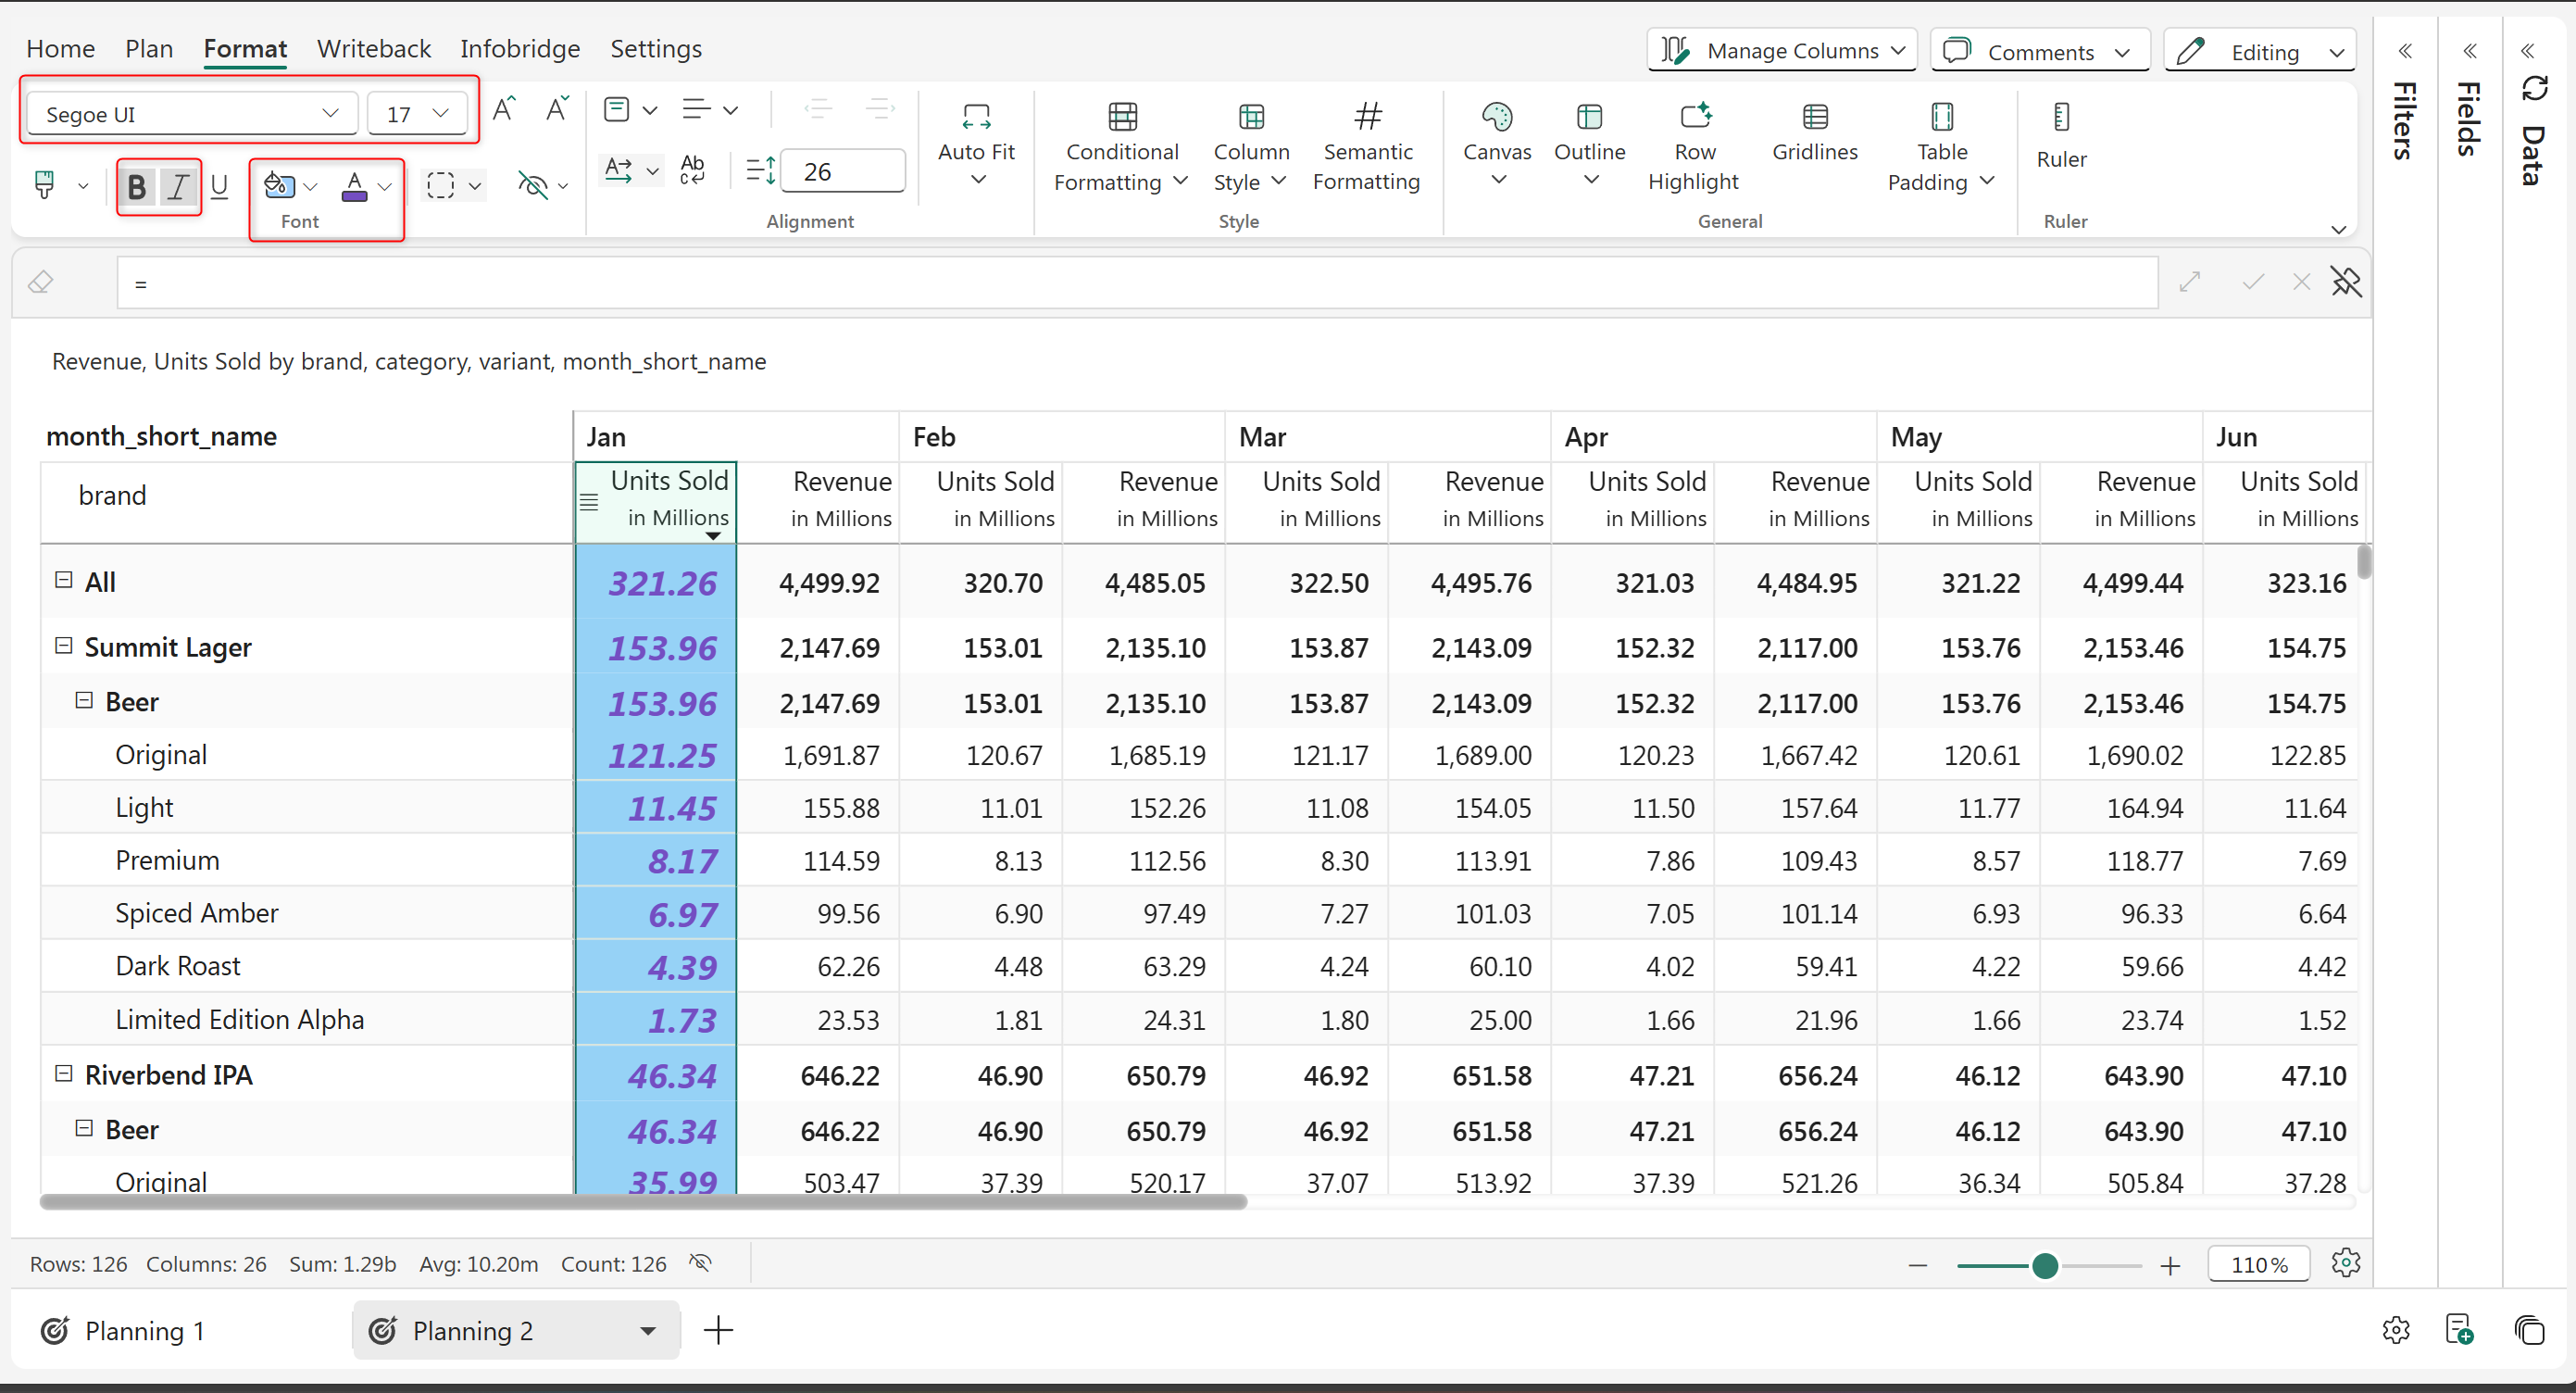
Bold, Italics and Underline styles can be applied.

#### d) Font/background color

You can use the fill color option to apply background color to an entire column or row or even an individual cell.

And use the font color option to change the foreground color or the font color of the data values, row or column headings, and subheadings.

<figure><img src="/files/g8IqJUNk5B3P0l3wv2fN" alt=""><figcaption><p>Formatting options like Font Style, Size, Bold, Italic, Font Color, and Background have been set to column.</p></figcaption></figure>

#### e) Format painter

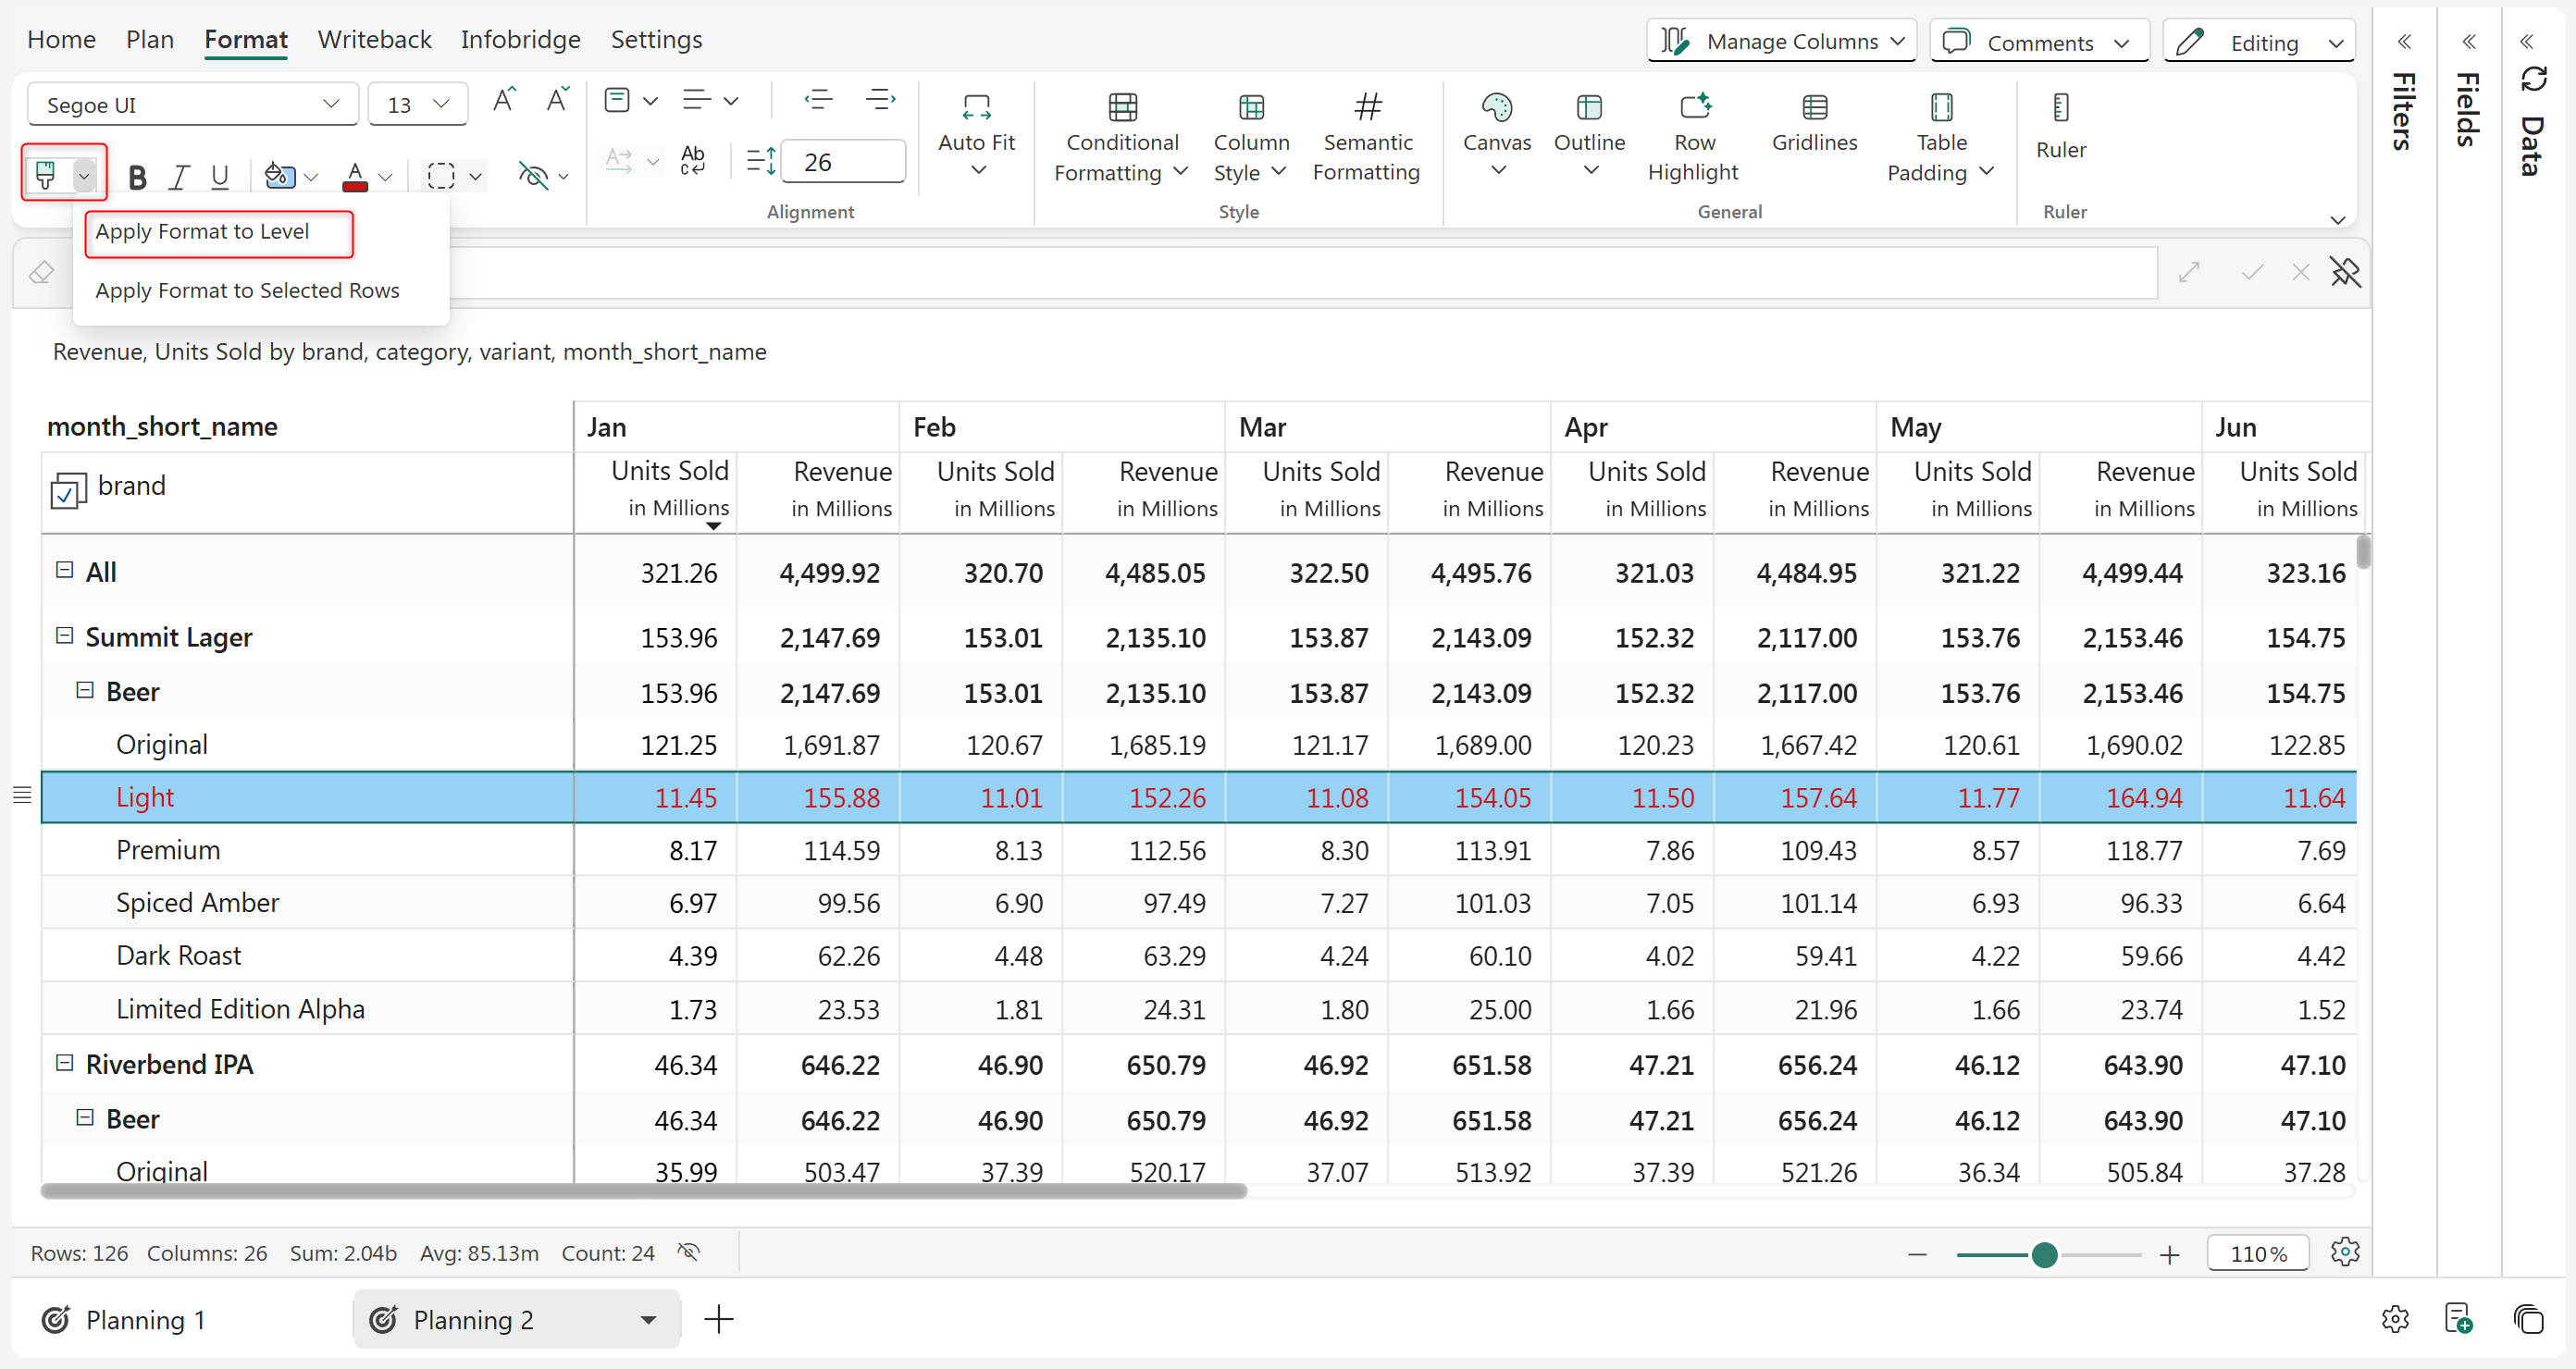
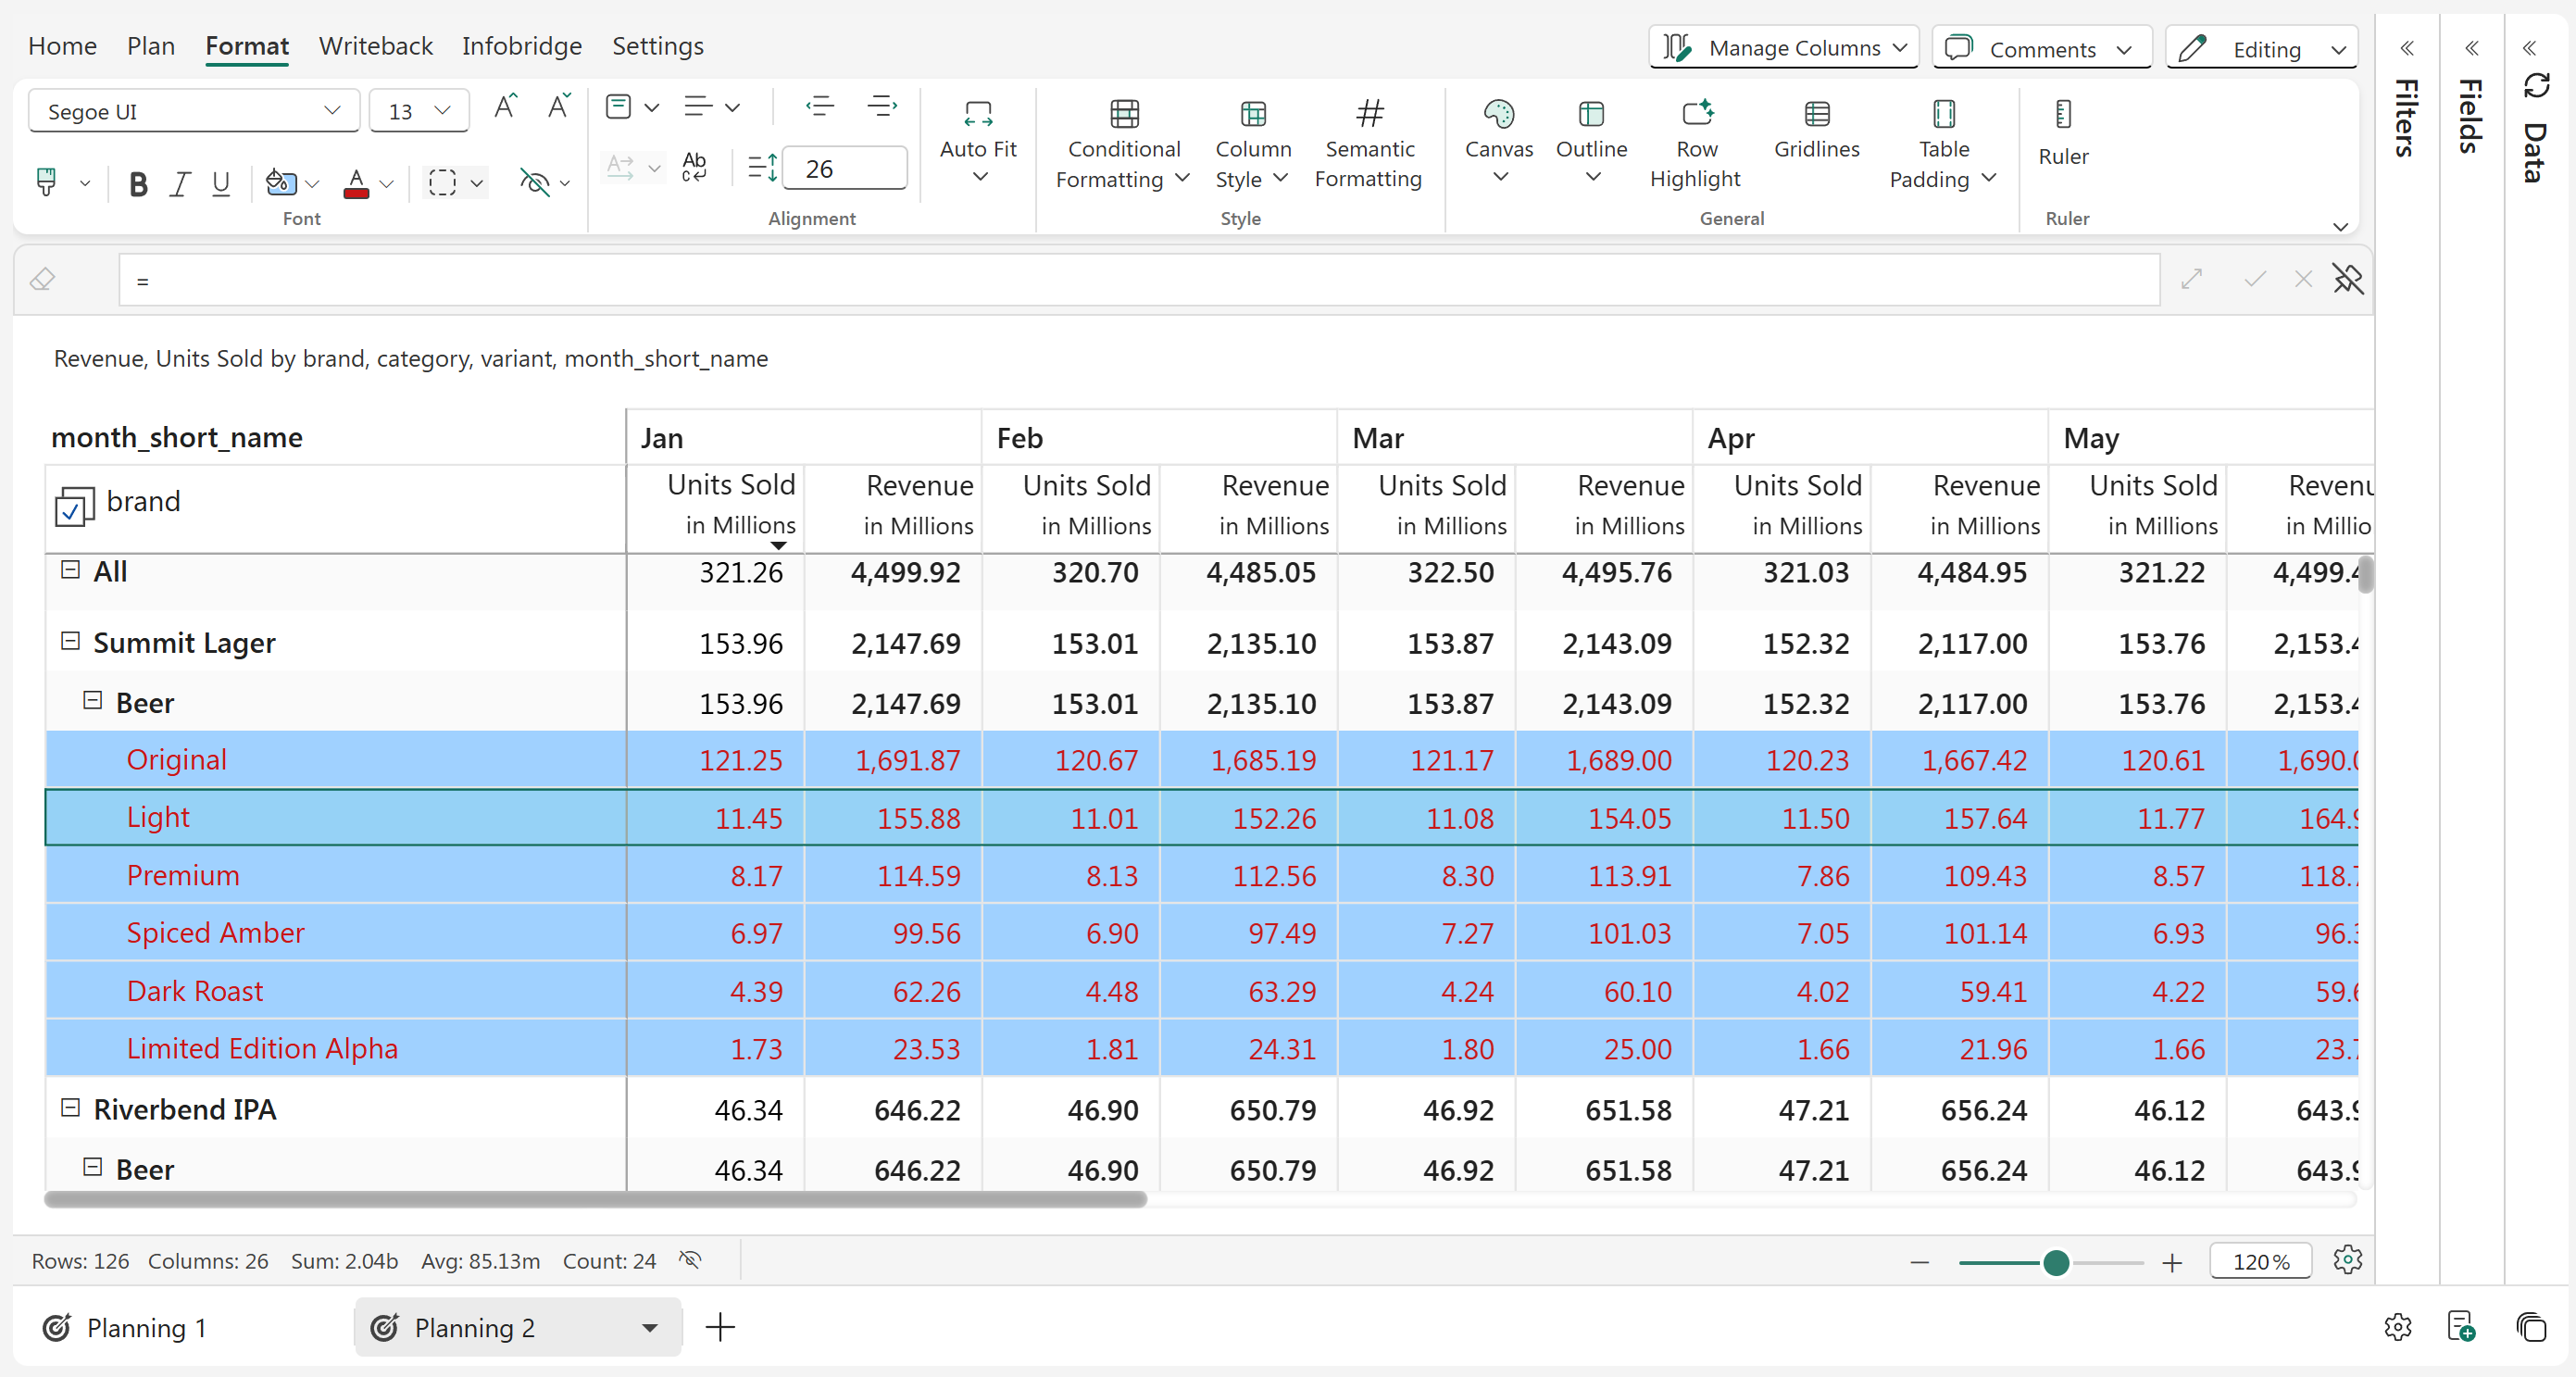
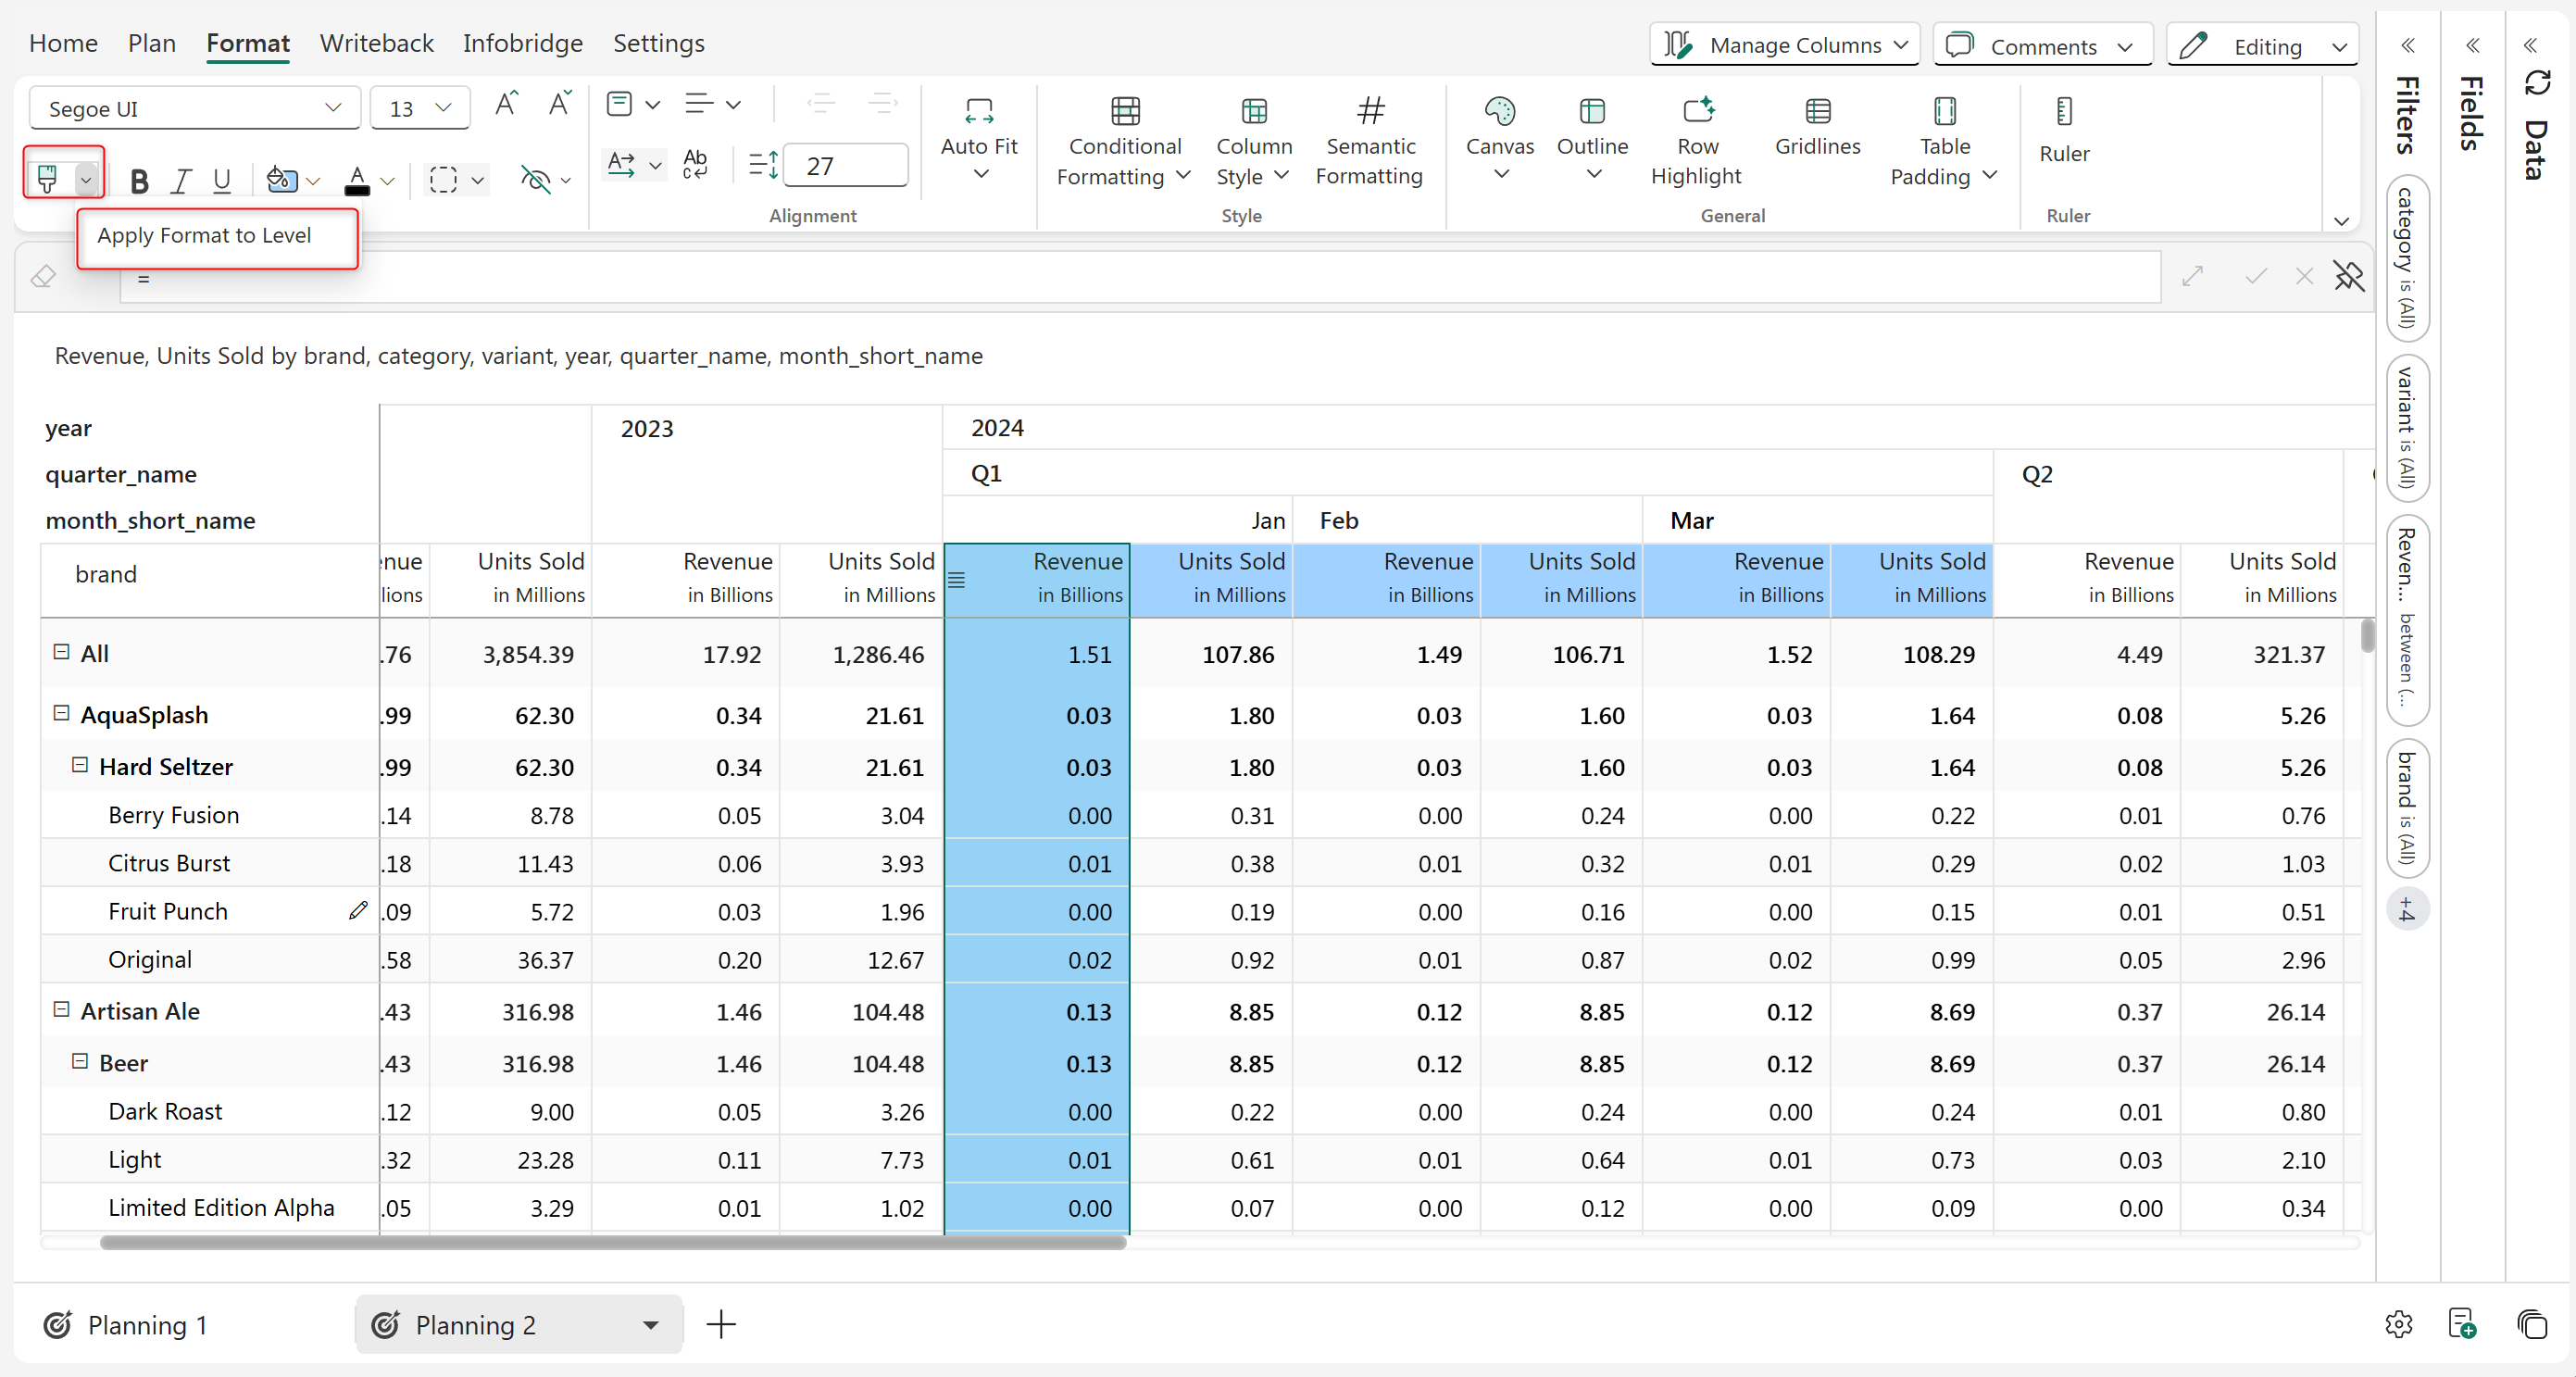
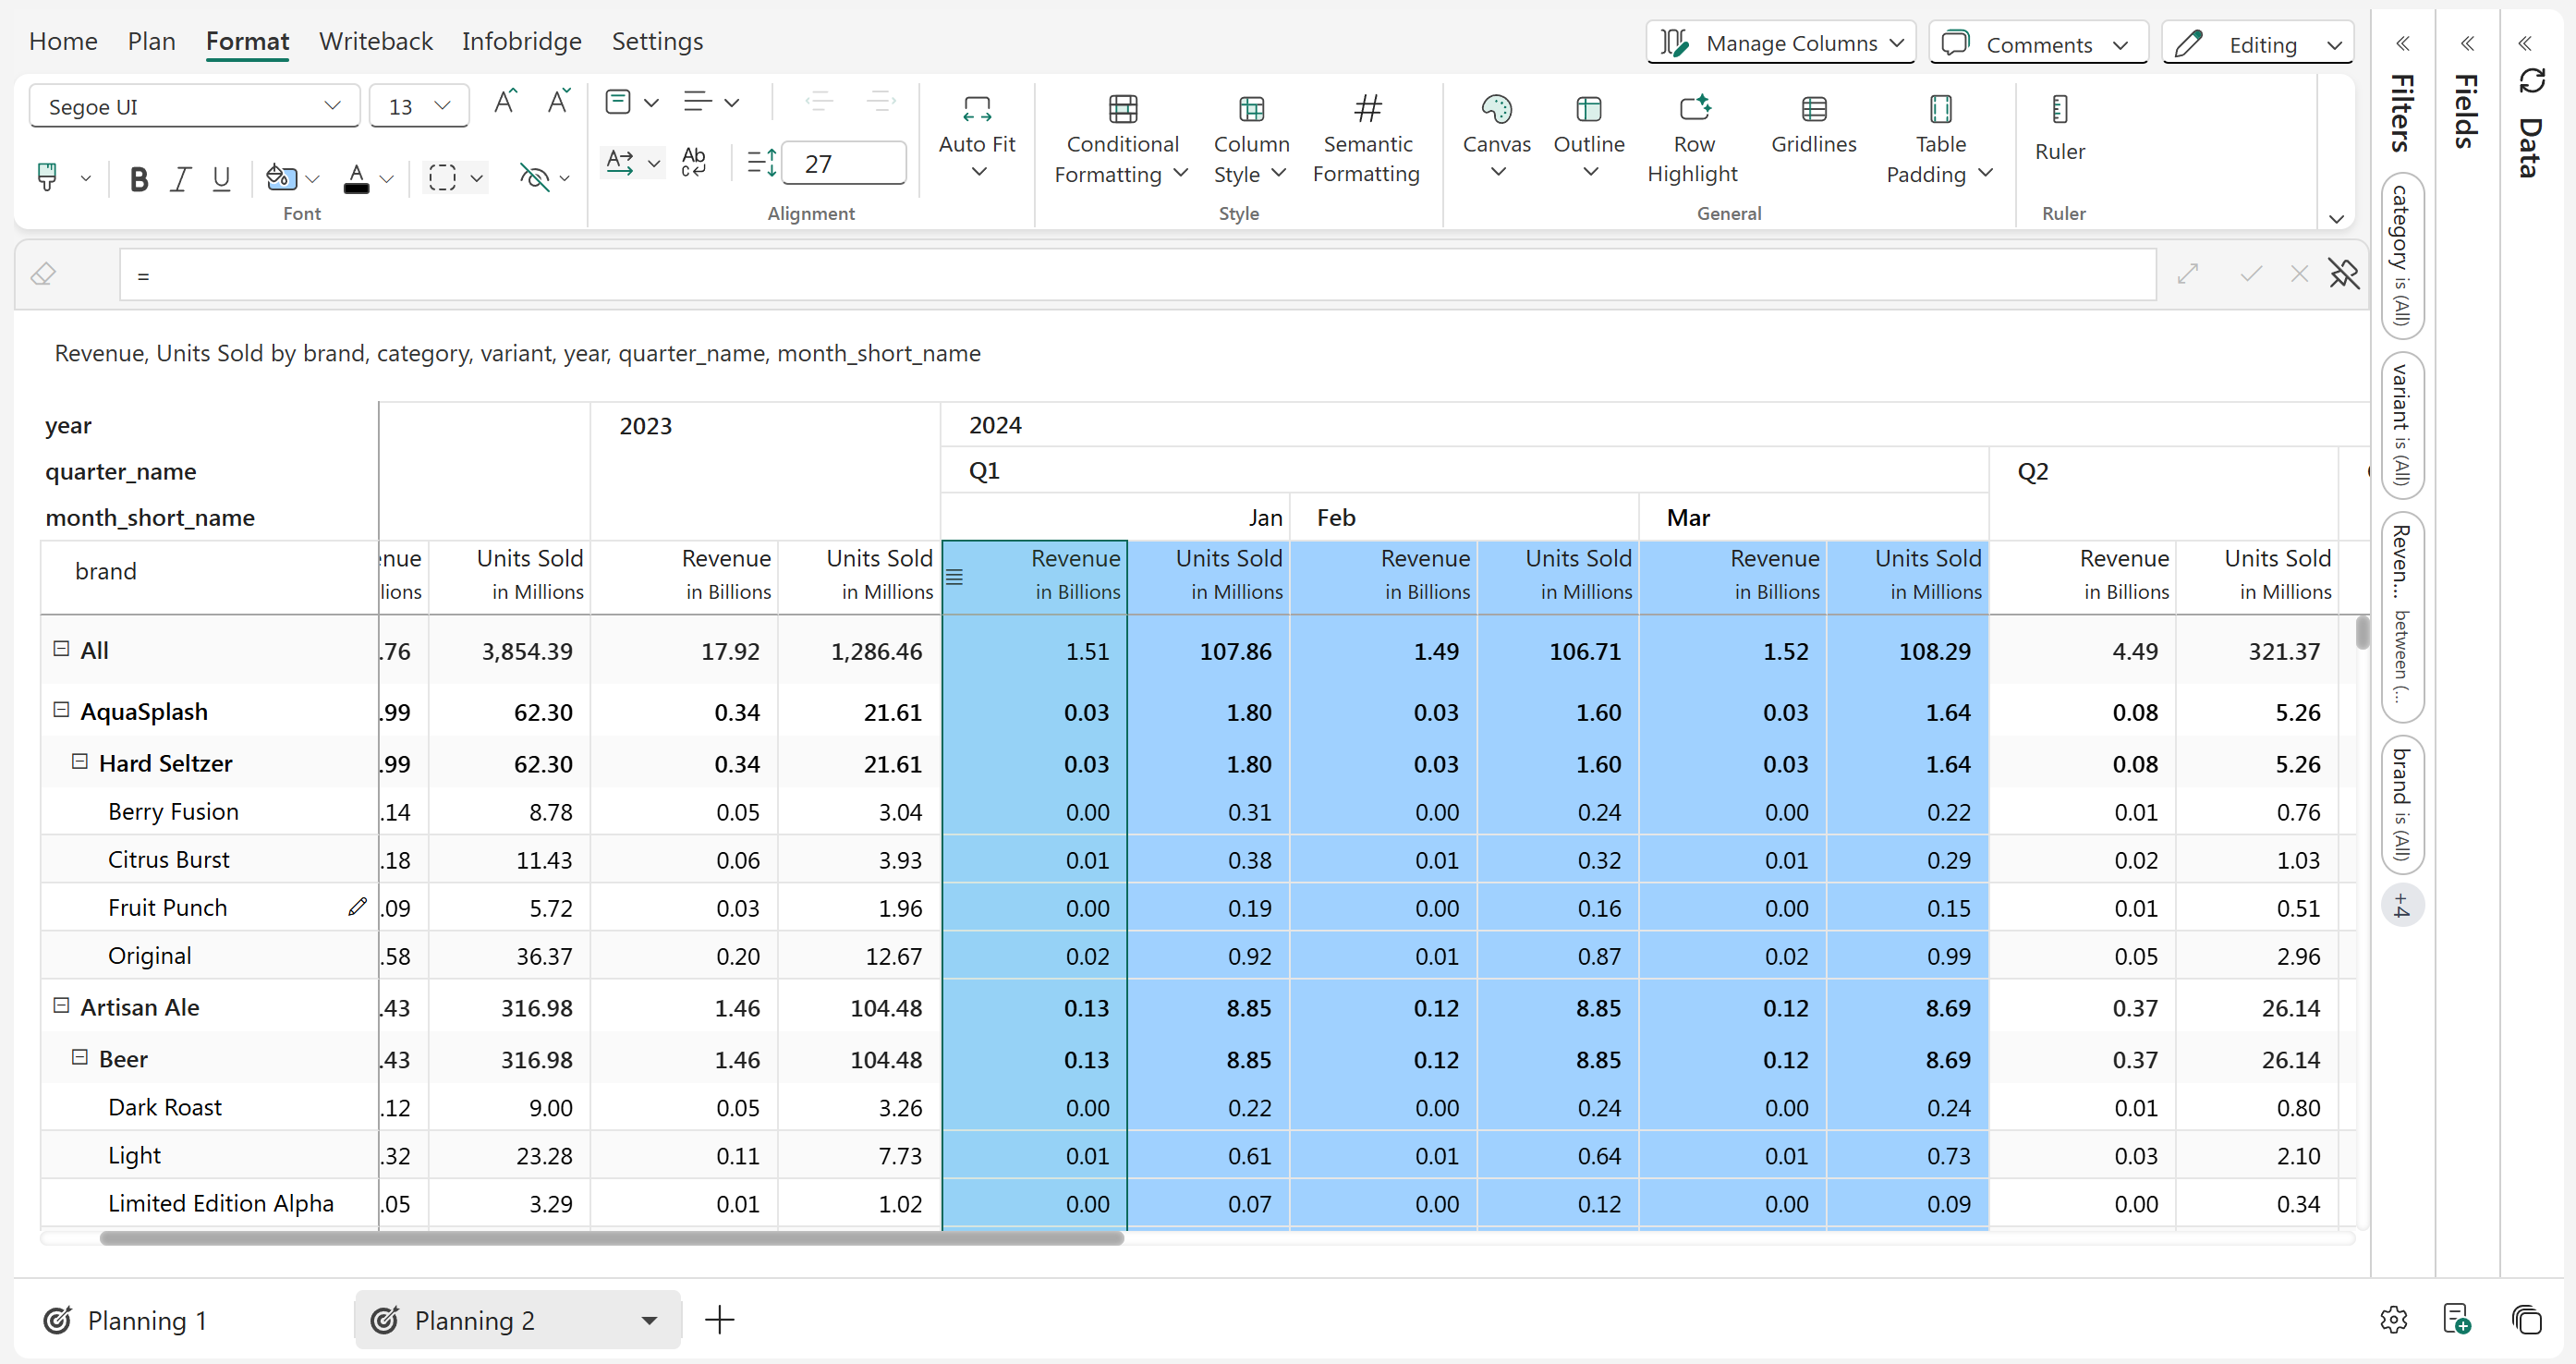
You can copy cell formatting using the 'Format painter' option just as in Excel. However, Plan goes one step further. If you have applied formatting to a specific hierarchy level, like the Category, you can instantly replicate that formatting across all other Categories using the **Apply Format to Level** option. In the example below, you can apply it to all the other Categories using the 'Apply format to level' option.

<div><figure><img src="/files/CM4xklj4njUJ5fHMtyRb" alt=""><figcaption></figcaption></figure> <figure><img src="/files/VuV3ldloHMcoqJEdDBXd" alt=""><figcaption></figcaption></figure></div>

<div><figure><img src="https://github.com/lumelinc/PowerTableDocs/blob/main/.gitbook/assets/2.4.2.4%20format%20level%201.png" alt=""><figcaption><p>Apply format to level option</p></figcaption></figure> <figure><img src="https://github.com/lumelinc/PowerTableDocs/blob/main/.gitbook/assets/2.4.2.4%20format%20level%202.png" alt=""><figcaption><p>Format applied to level</p></figcaption></figure></div>

#### f) Borders

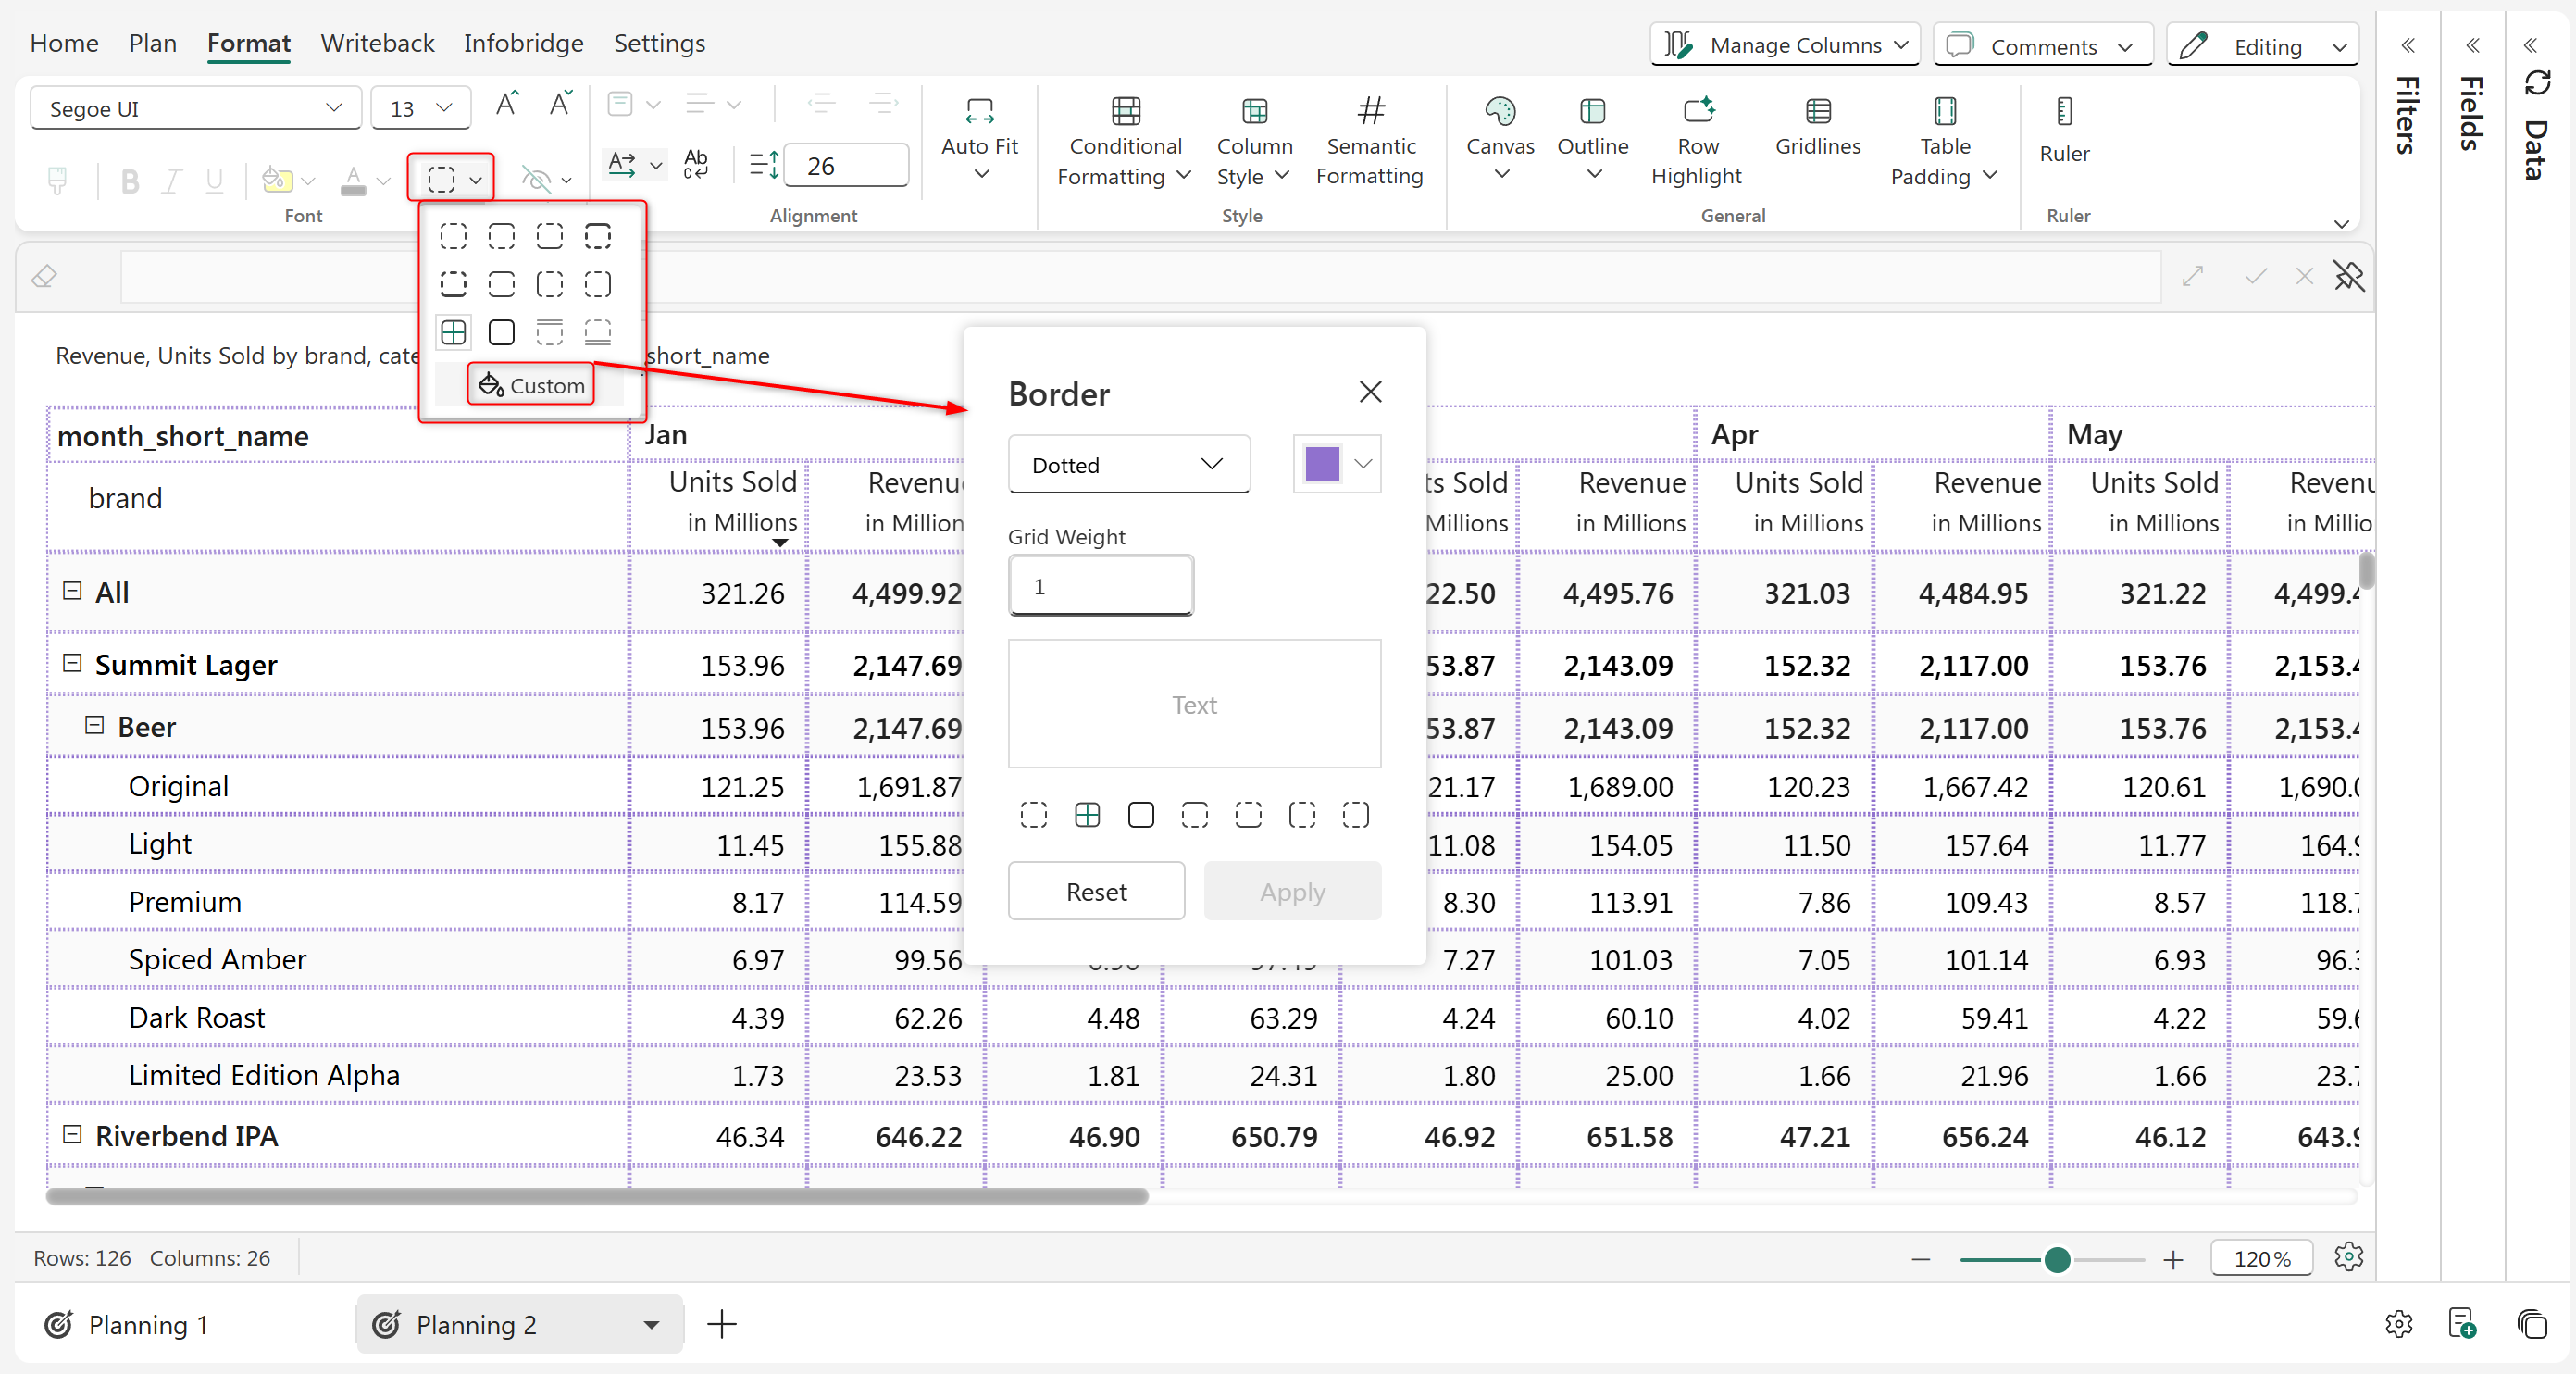
Plan provides several predefined border styles and they can be applied at a cell/row/column level. If the predefined cell borders do not meet your needs, you can create a custom border by clicking on the 'Custom' option.

<figure><img src="/files/CaXMyhmsVa2Ym3dt0NBX" alt=""><figcaption></figcaption></figure>

<figure><img src="https://github.com/lumelinc/PowerTableDocs/blob/main/.gitbook/assets/2.4.2.2%20borders.png" alt=""><figcaption><p>Applying borders</p></figcaption></figure>

To remove custom borders or predefined borders click on 'Reset' or select the 'No borders' option from the Borders icon (the 1st icon).

## 2. Alignment options

Let's take a quick look at the alignment section in this video.

#### a) Horizontal/vertical alignment

Horizontal alignment can be formatted using the Align left, right, and center options. For vertical alignment, the options are Align top, bottom, and middle.

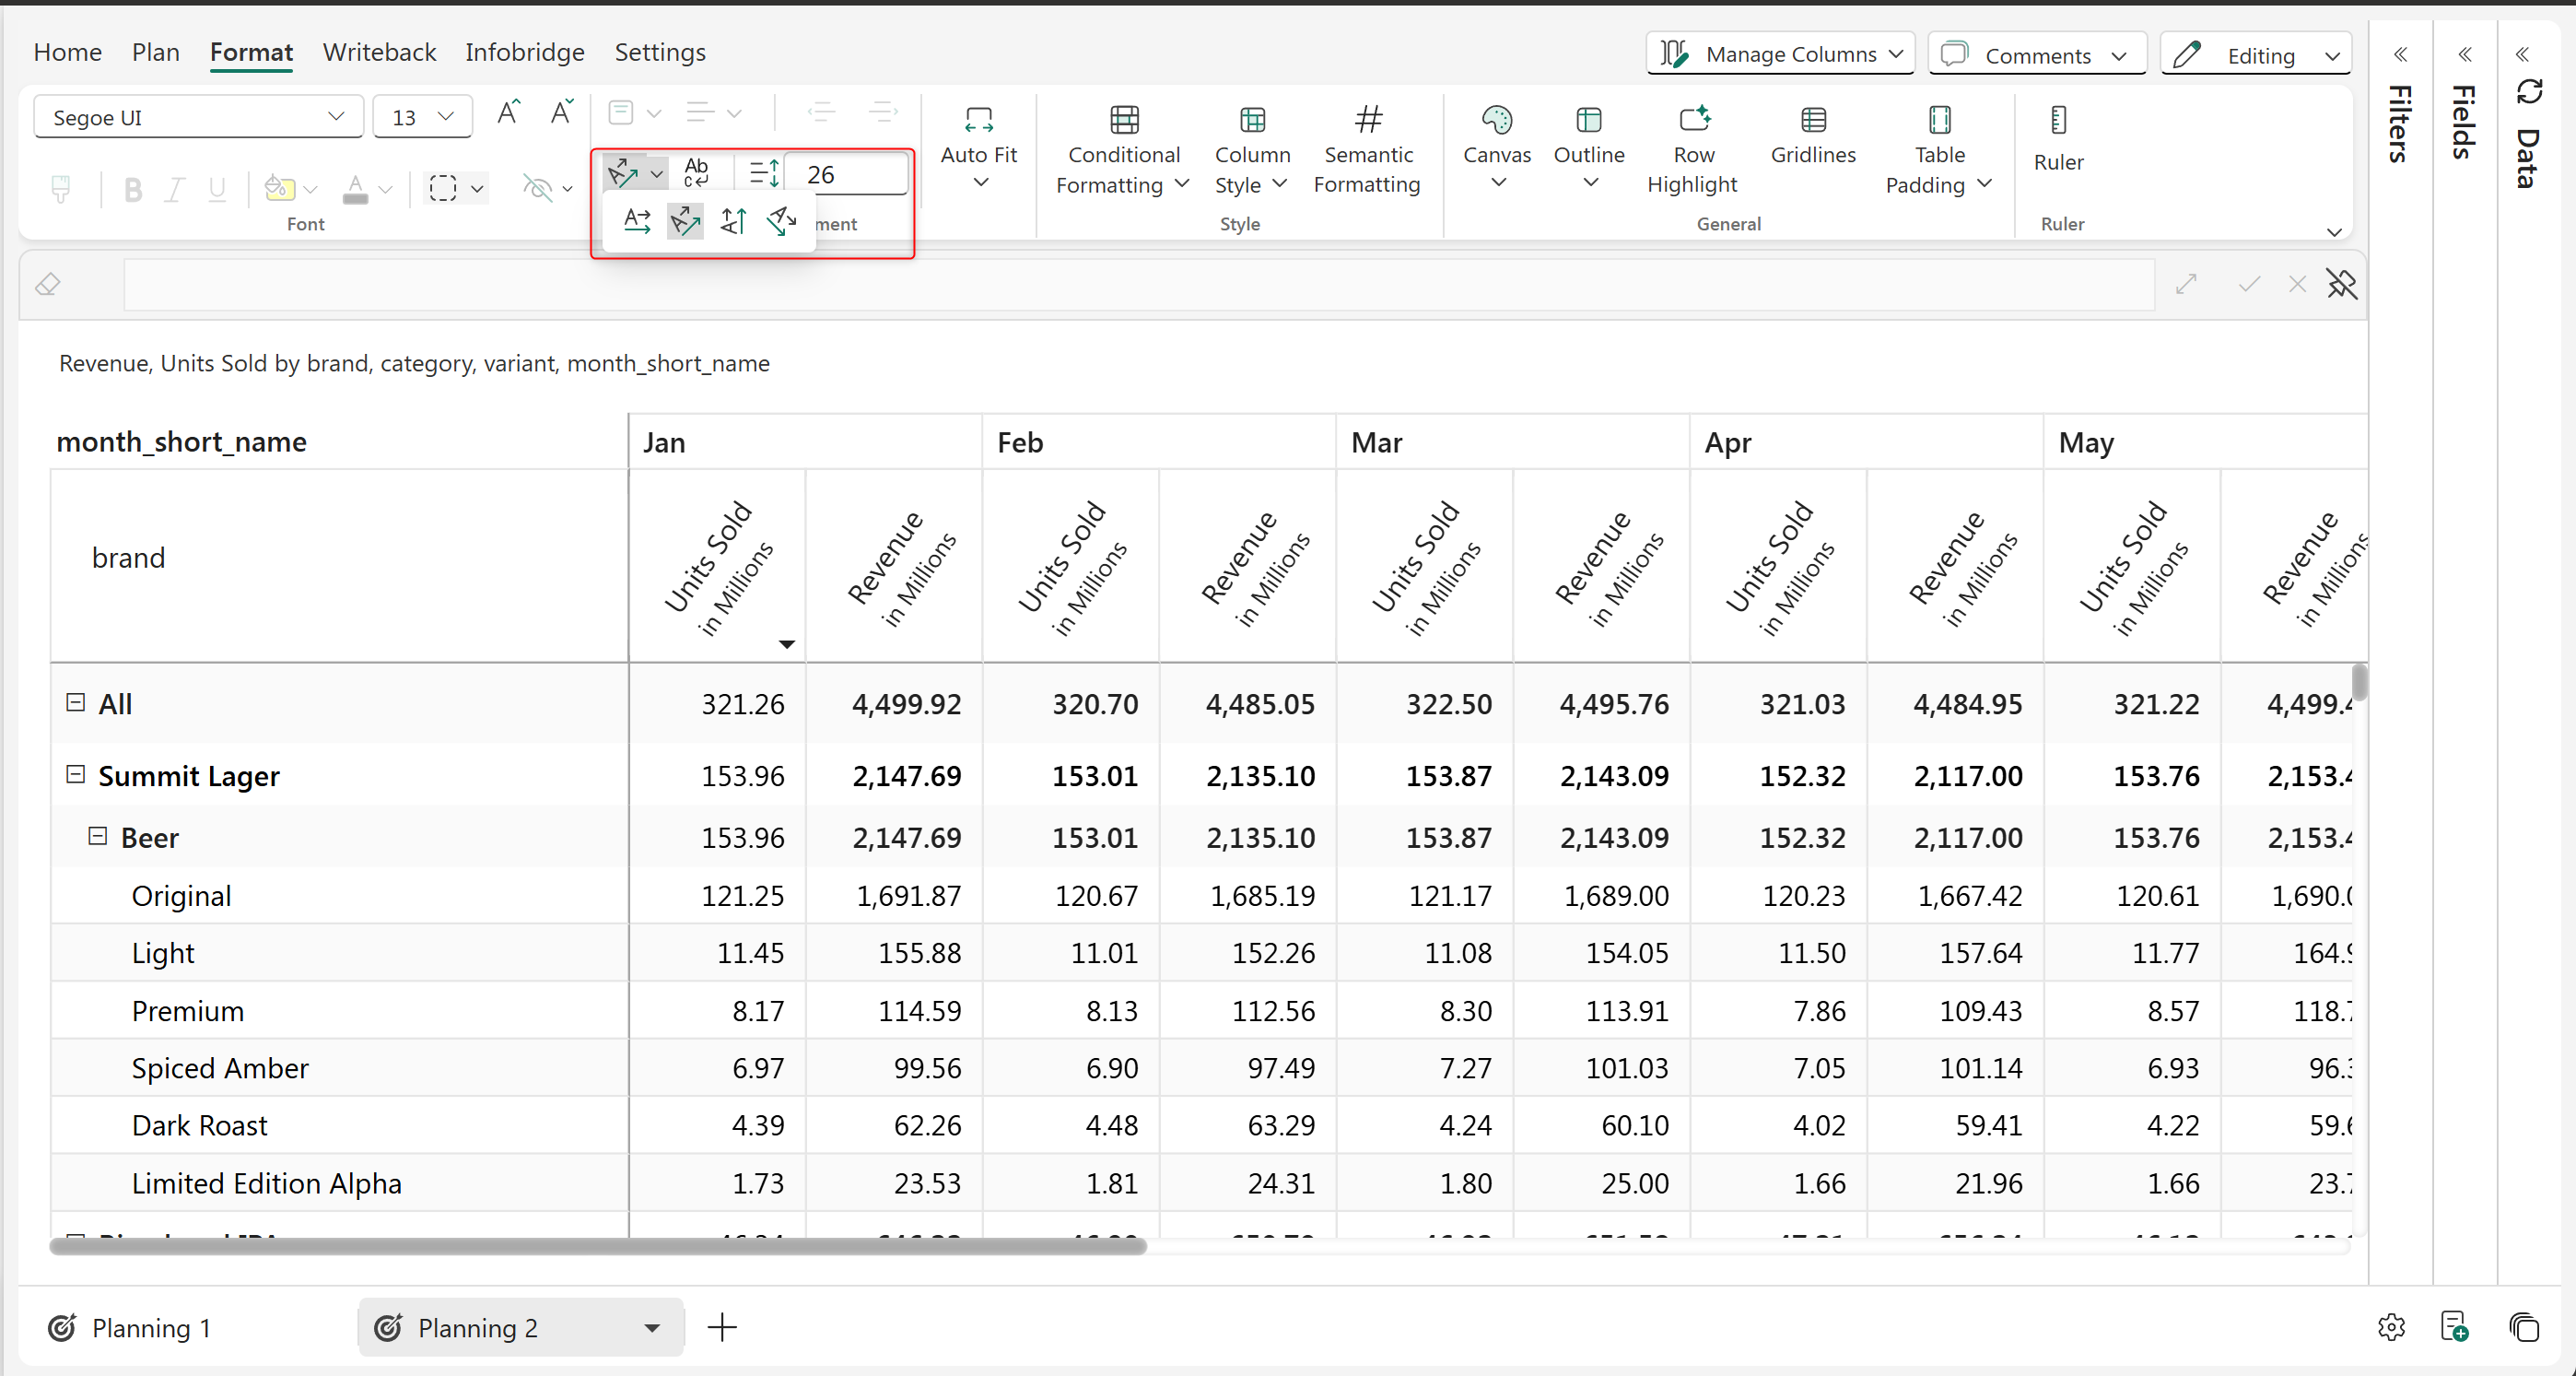
#### b) Header orientation

Column and measure header orientations can be changed using the highlighted options. This is very helpful when you have a lot of columns in your report.

<figure><img src="/files/ExOXvCdN6MVSbEiSik4R" alt=""><figcaption></figcaption></figure>

<figure><img src="https://github.com/lumelinc/PowerTableDocs/blob/main/.gitbook/assets/2.4.2.3%20header%20orientation%20(1).png" alt=""><figcaption><p>Header orientation options</p></figcaption></figure>

#### c) Increase/decrease indent

Use the indentation icon from the toolbar to indent specific values. This feature makes creating financial statements a breeze.

#### d) Row size

You can increase or decrease row size manually. This is especially useful when inserting inline charts.

#### e) Word wrap

If your measure headers are very long, you can enable the word wrap option to ensure that the entire header is displayed.

#### **f) Fit Content**

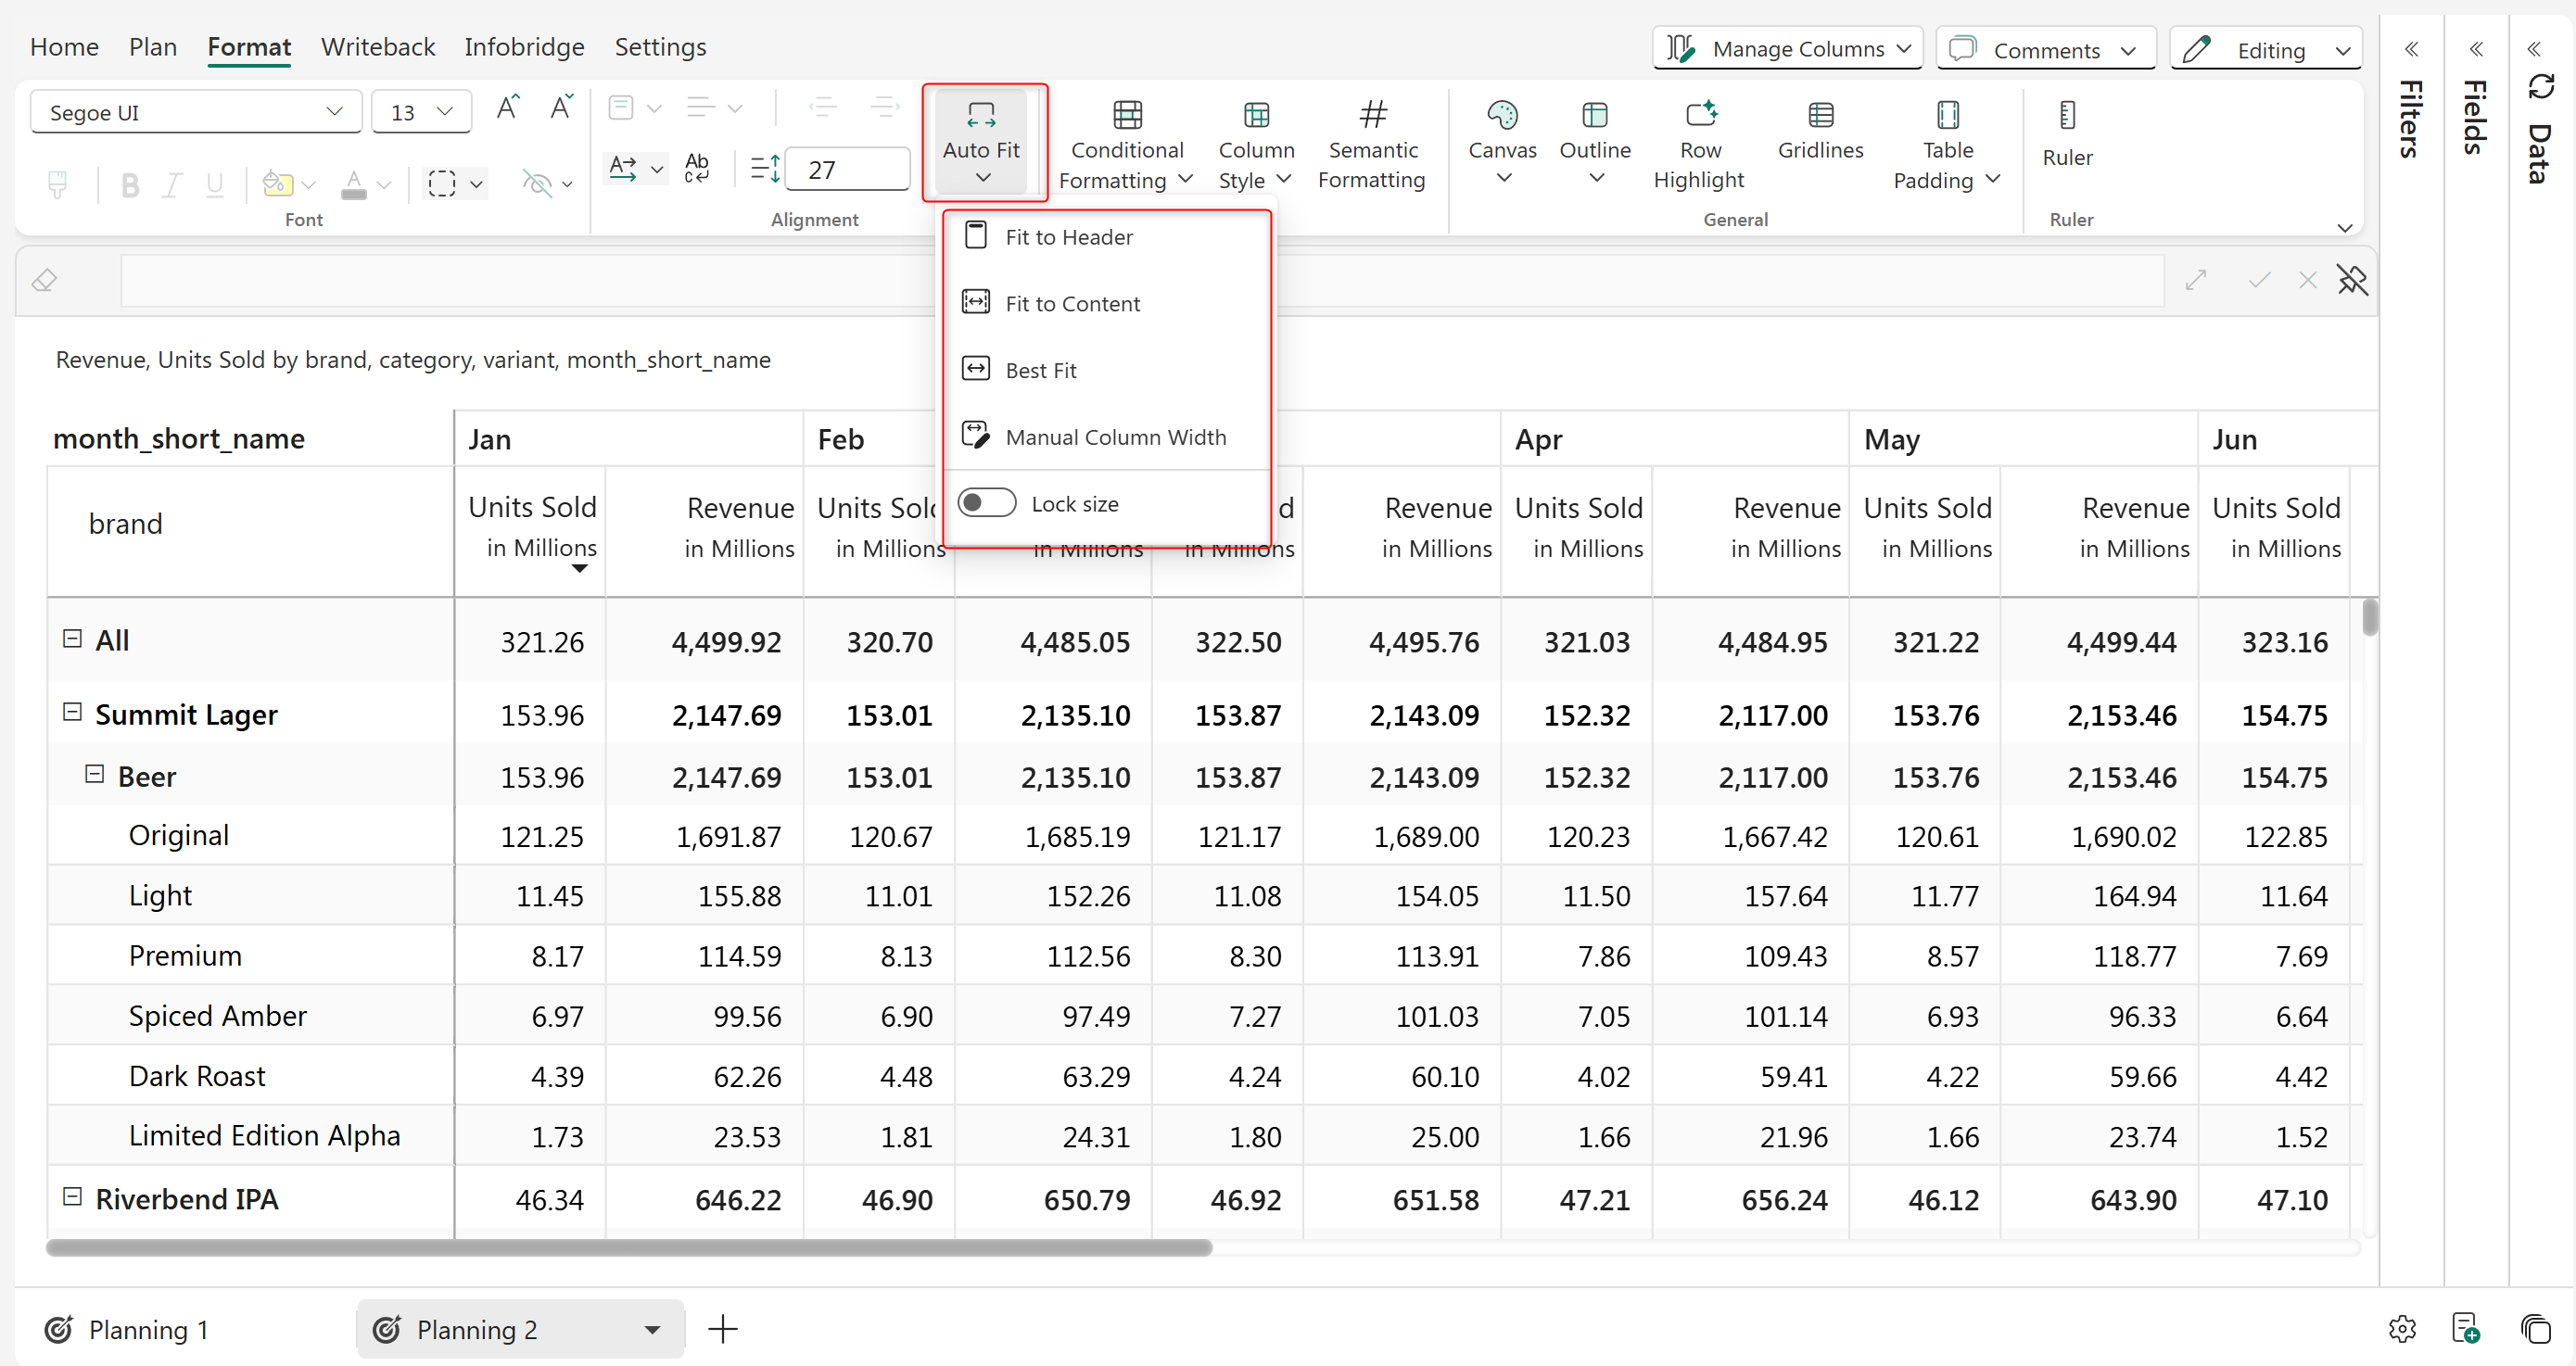
You can choose the fit mode that is best suited for your data. we have options like

* Fit to Header - Column size is set as per the Header.
* Fit to Content - Column size is set based on the Content.
* Best Fit - Auto fits the column size suitably
* Manual Column Width - Customize your Column Width
* Lock size - You can lock the column size.

<figure><img src="/files/7MDvrBB4knToLTxCzZ2l" alt=""><figcaption></figcaption></figure>

<figure><img src="https://github.com/lumelinc/PowerTableDocs/blob/main/.gitbook/assets/image%20(1296).png" alt=""><figcaption><p>Auto Fit options to set the Column Width</p></figcaption></figure>

To know more, please refer to the [manage column width](/planning/working-with-lumel-epm/3.-basic-interactions/manage-column-widths.md) section

## 3. Inserting icons in headers

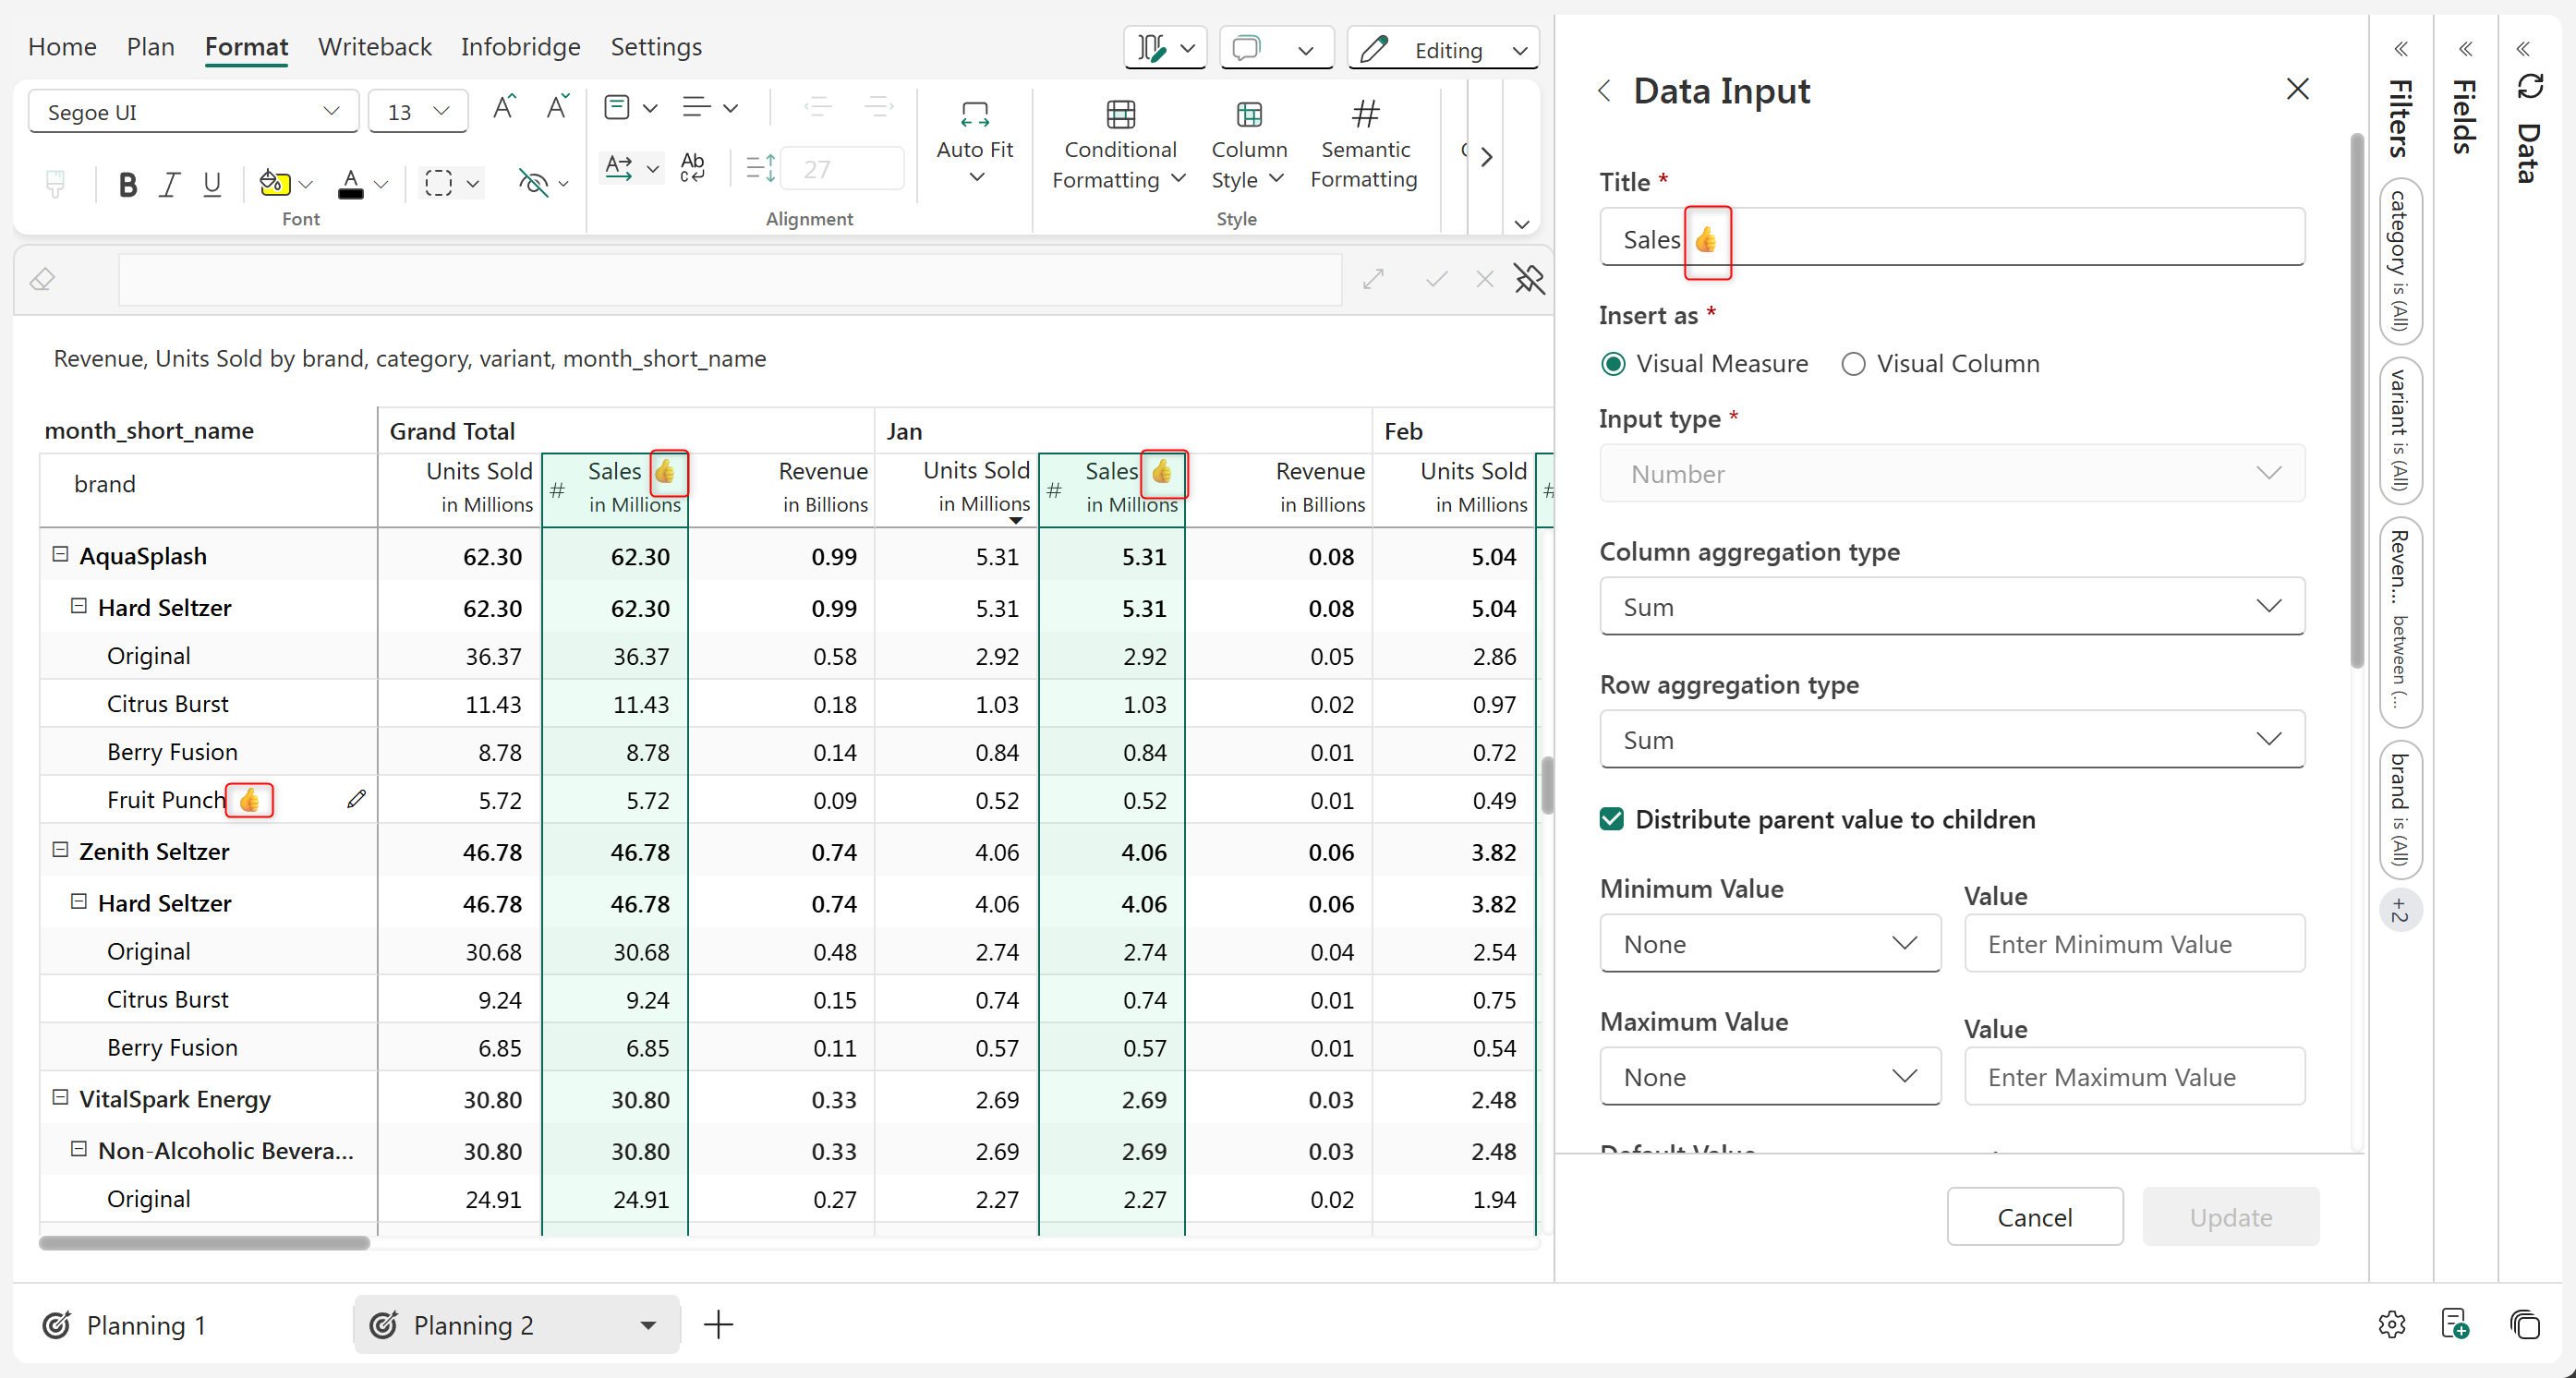
Enhance the visual appeal of your reports with icons and symbols in measures headers, column headers, and inserted rows. You can copy the preferred icon and paste it in the title section.

<figure><img src="/files/IRi39C9MROjDdAnXghLe" alt=""><figcaption></figcaption></figure>

<figure><img src="https://github.com/lumelinc/PowerTableDocs/blob/main/.gitbook/assets/image%20(159).png" alt=""><figcaption><p>Inserting icons in headers</p></figcaption></figure>

{% hint style="info" %}
Icon can be inserted only in inserted measures, columns and rows.
{% endhint %}

## 4. Auto-format for column dimensions

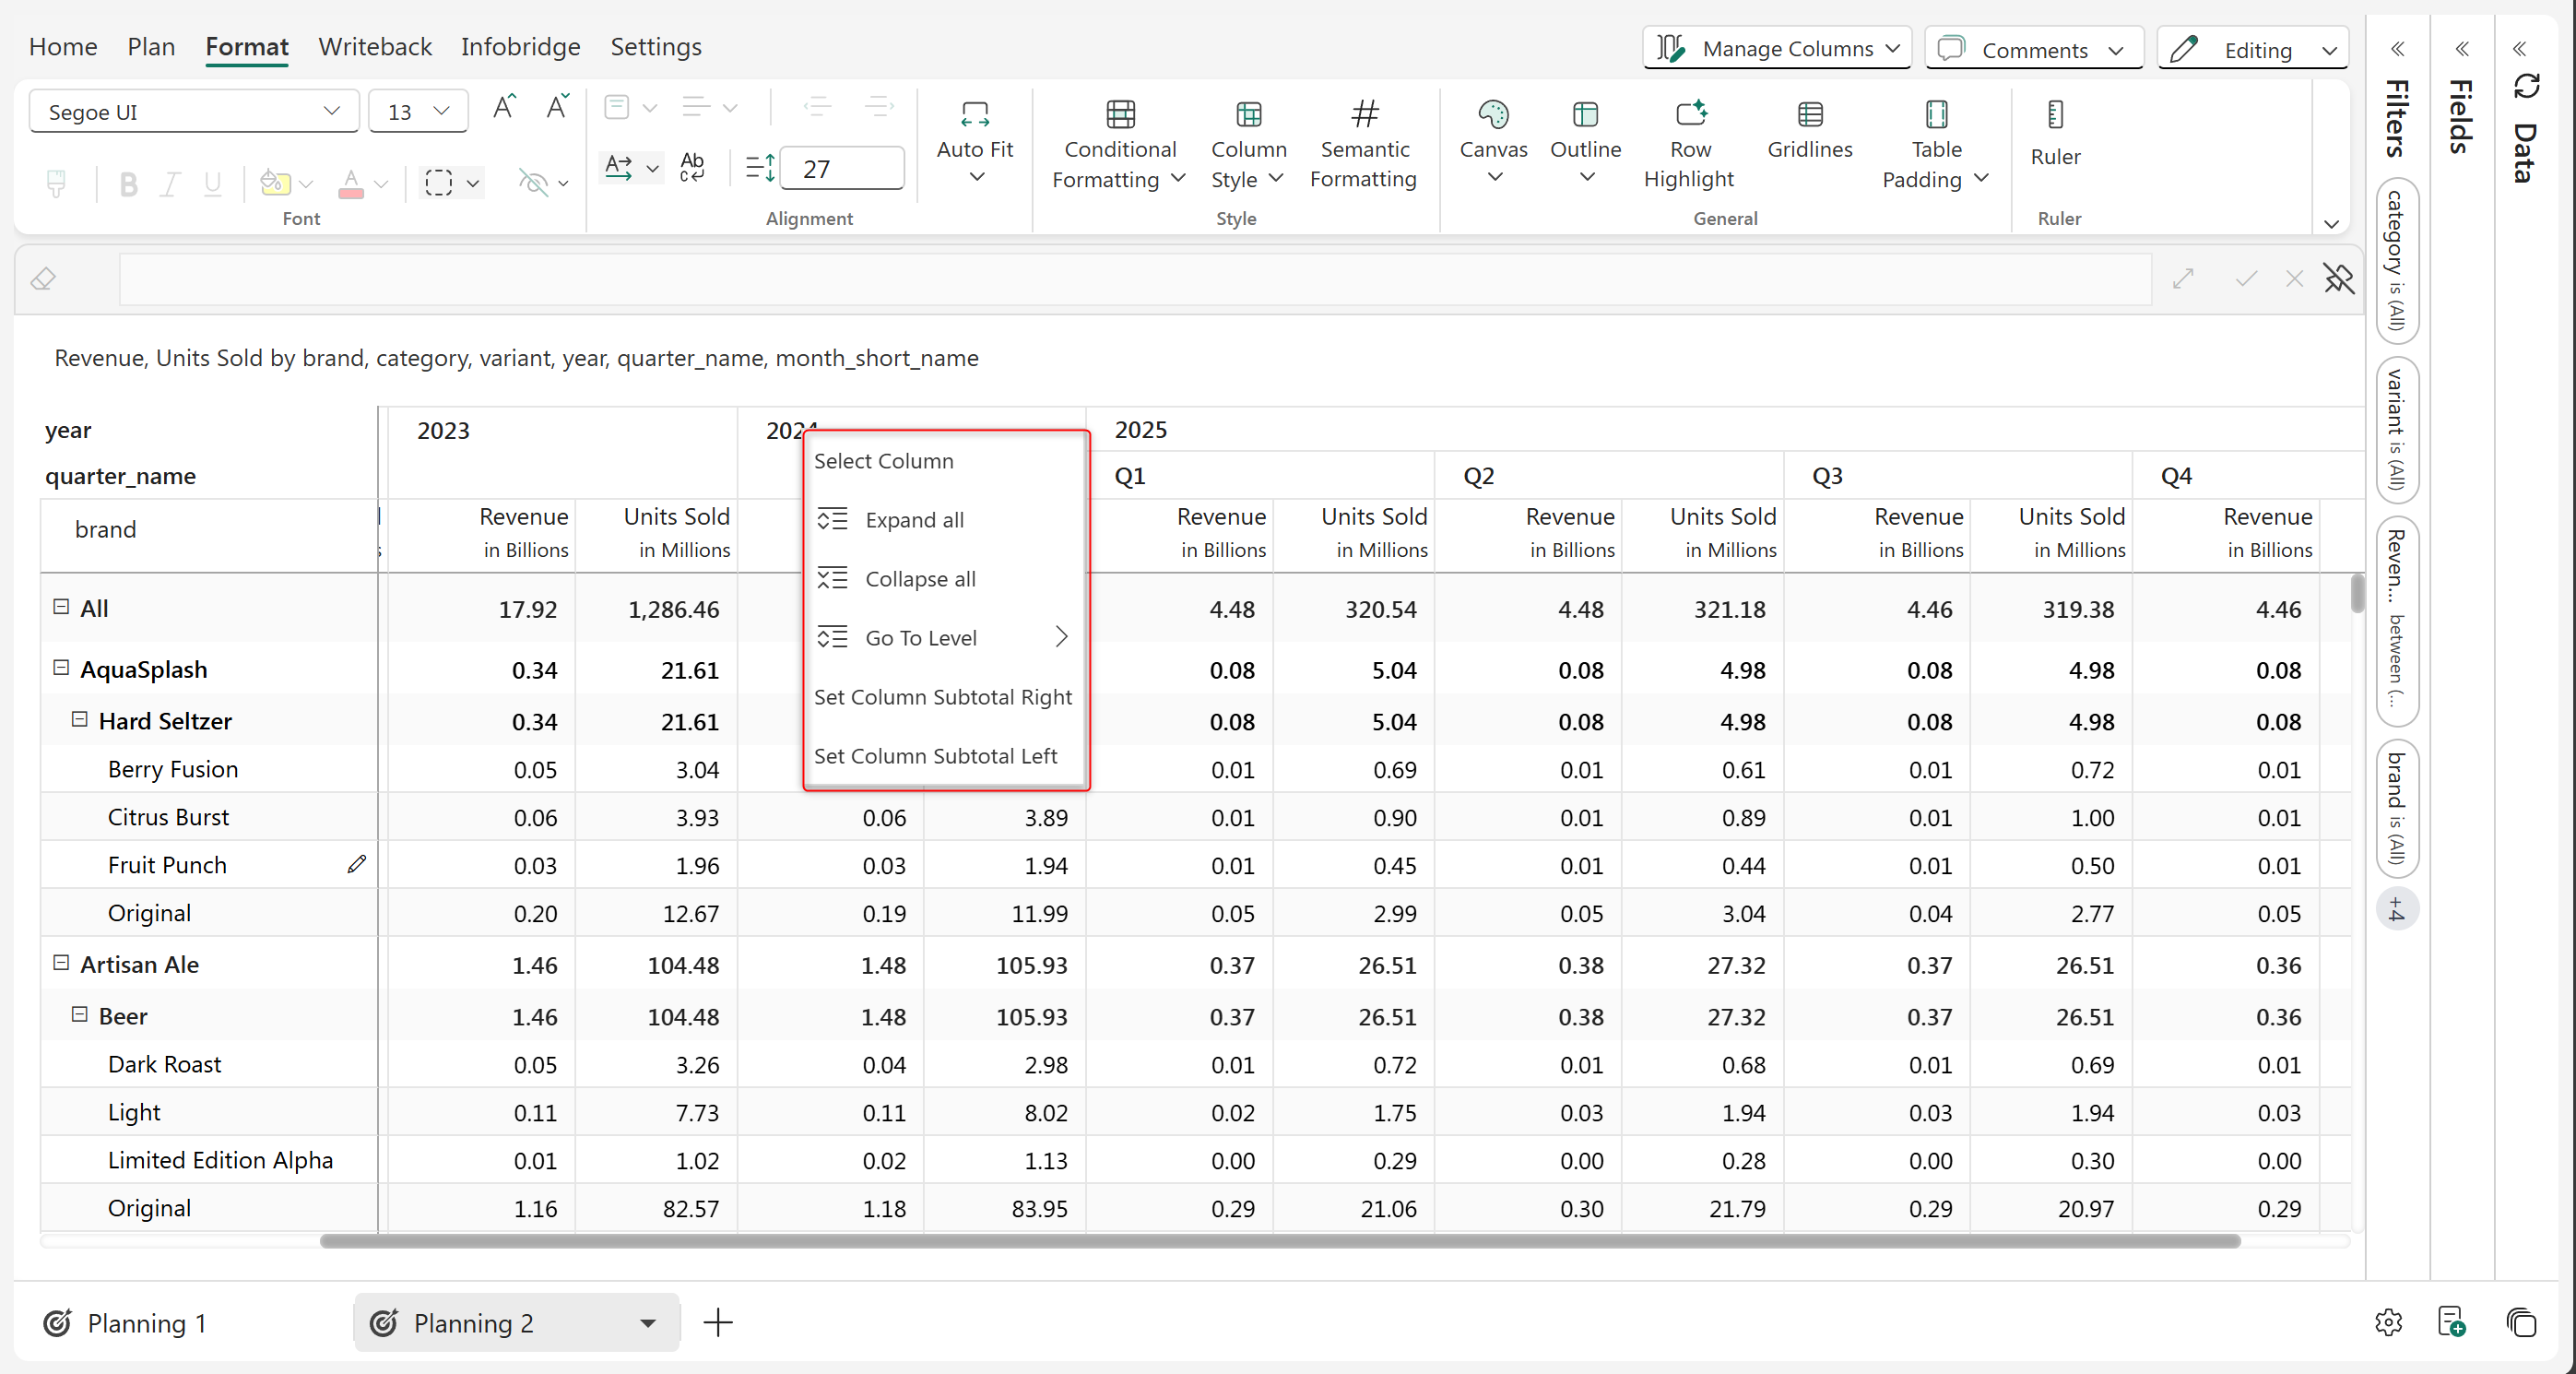
When column hierarchies are involved, Plan allows you to select a particular level of the hierarchy by right clicking that level and choosing **Select column** from the context menu.

<figure><img src="/files/8GDoI04UqtUoVD1qSHDd" alt=""><figcaption></figcaption></figure>

<figure><img src="https://github.com/lumelinc/PowerTableDocs/blob/main/.gitbook/assets/image%20(2586).png" alt=""><figcaption><p>Select column option</p></figcaption></figure>

This feature comes in handy when you need to apply formatting to a particular level of the hierarchy. Here, we have highlighted the Revenue Column of Q1 in 2024, which can be applied to all the columnA in the same hierarchy by Applying the Format to Level option

<figure><img src="/files/rOL6sd5QLS43AcXSzGpH" alt=""><figcaption><p>We've highlighted Q1 Revenue Column of 2024 in blue.</p></figcaption></figure>

The image below shows the format applied to all the columns in that level

<figure><img src="/files/m4lP60czJfcOUNbJ6ZJ6" alt=""><figcaption><p>Formatting applied to all the columns in a level.</p></figcaption></figure>

In the next section, we'll see how to handle [totals & subtotals](/planning-sheets/how-tos/basic-formatting/total-and-subtotals.md).

#### Resources

[Best Fonts for Financial Reporting](https://inforiver.com/blog/general/best-fonts-financial-reporting/)


---

# Agent Instructions: Querying This Documentation

If you need additional information that is not directly available in this page, you can query the documentation dynamically by asking a question.

Perform an HTTP GET request on the current page URL with the `ask` query parameter:

```
GET https://docs.fabricplan.com/planning-sheets/how-tos/basic-formatting/cell-header-and-value-formatting.md?ask=<question>
```

The question should be specific, self-contained, and written in natural language.
The response will contain a direct answer to the question and relevant excerpts and sources from the documentation.

Use this mechanism when the answer is not explicitly present in the current page, you need clarification or additional context, or you want to retrieve related documentation sections.