# Visualize simulations, budgets, and forecasts
## Visualize simulations, budgets, and forecasts
Plan, forecast, and visualize scenarios on live data sources without duplicating datasets, rebuilding models, or relying on technical teams. By unifying planning, budgeting, and forecasting data with visualizations, you can:
* Easily compare budgets, actuals, and forecasts
* Quickly identify and adjust variances that require action
* Evaluate multiple what-if scenarios
* Make real-time, strategic adjustments to budgets and forecasts based on visual insights
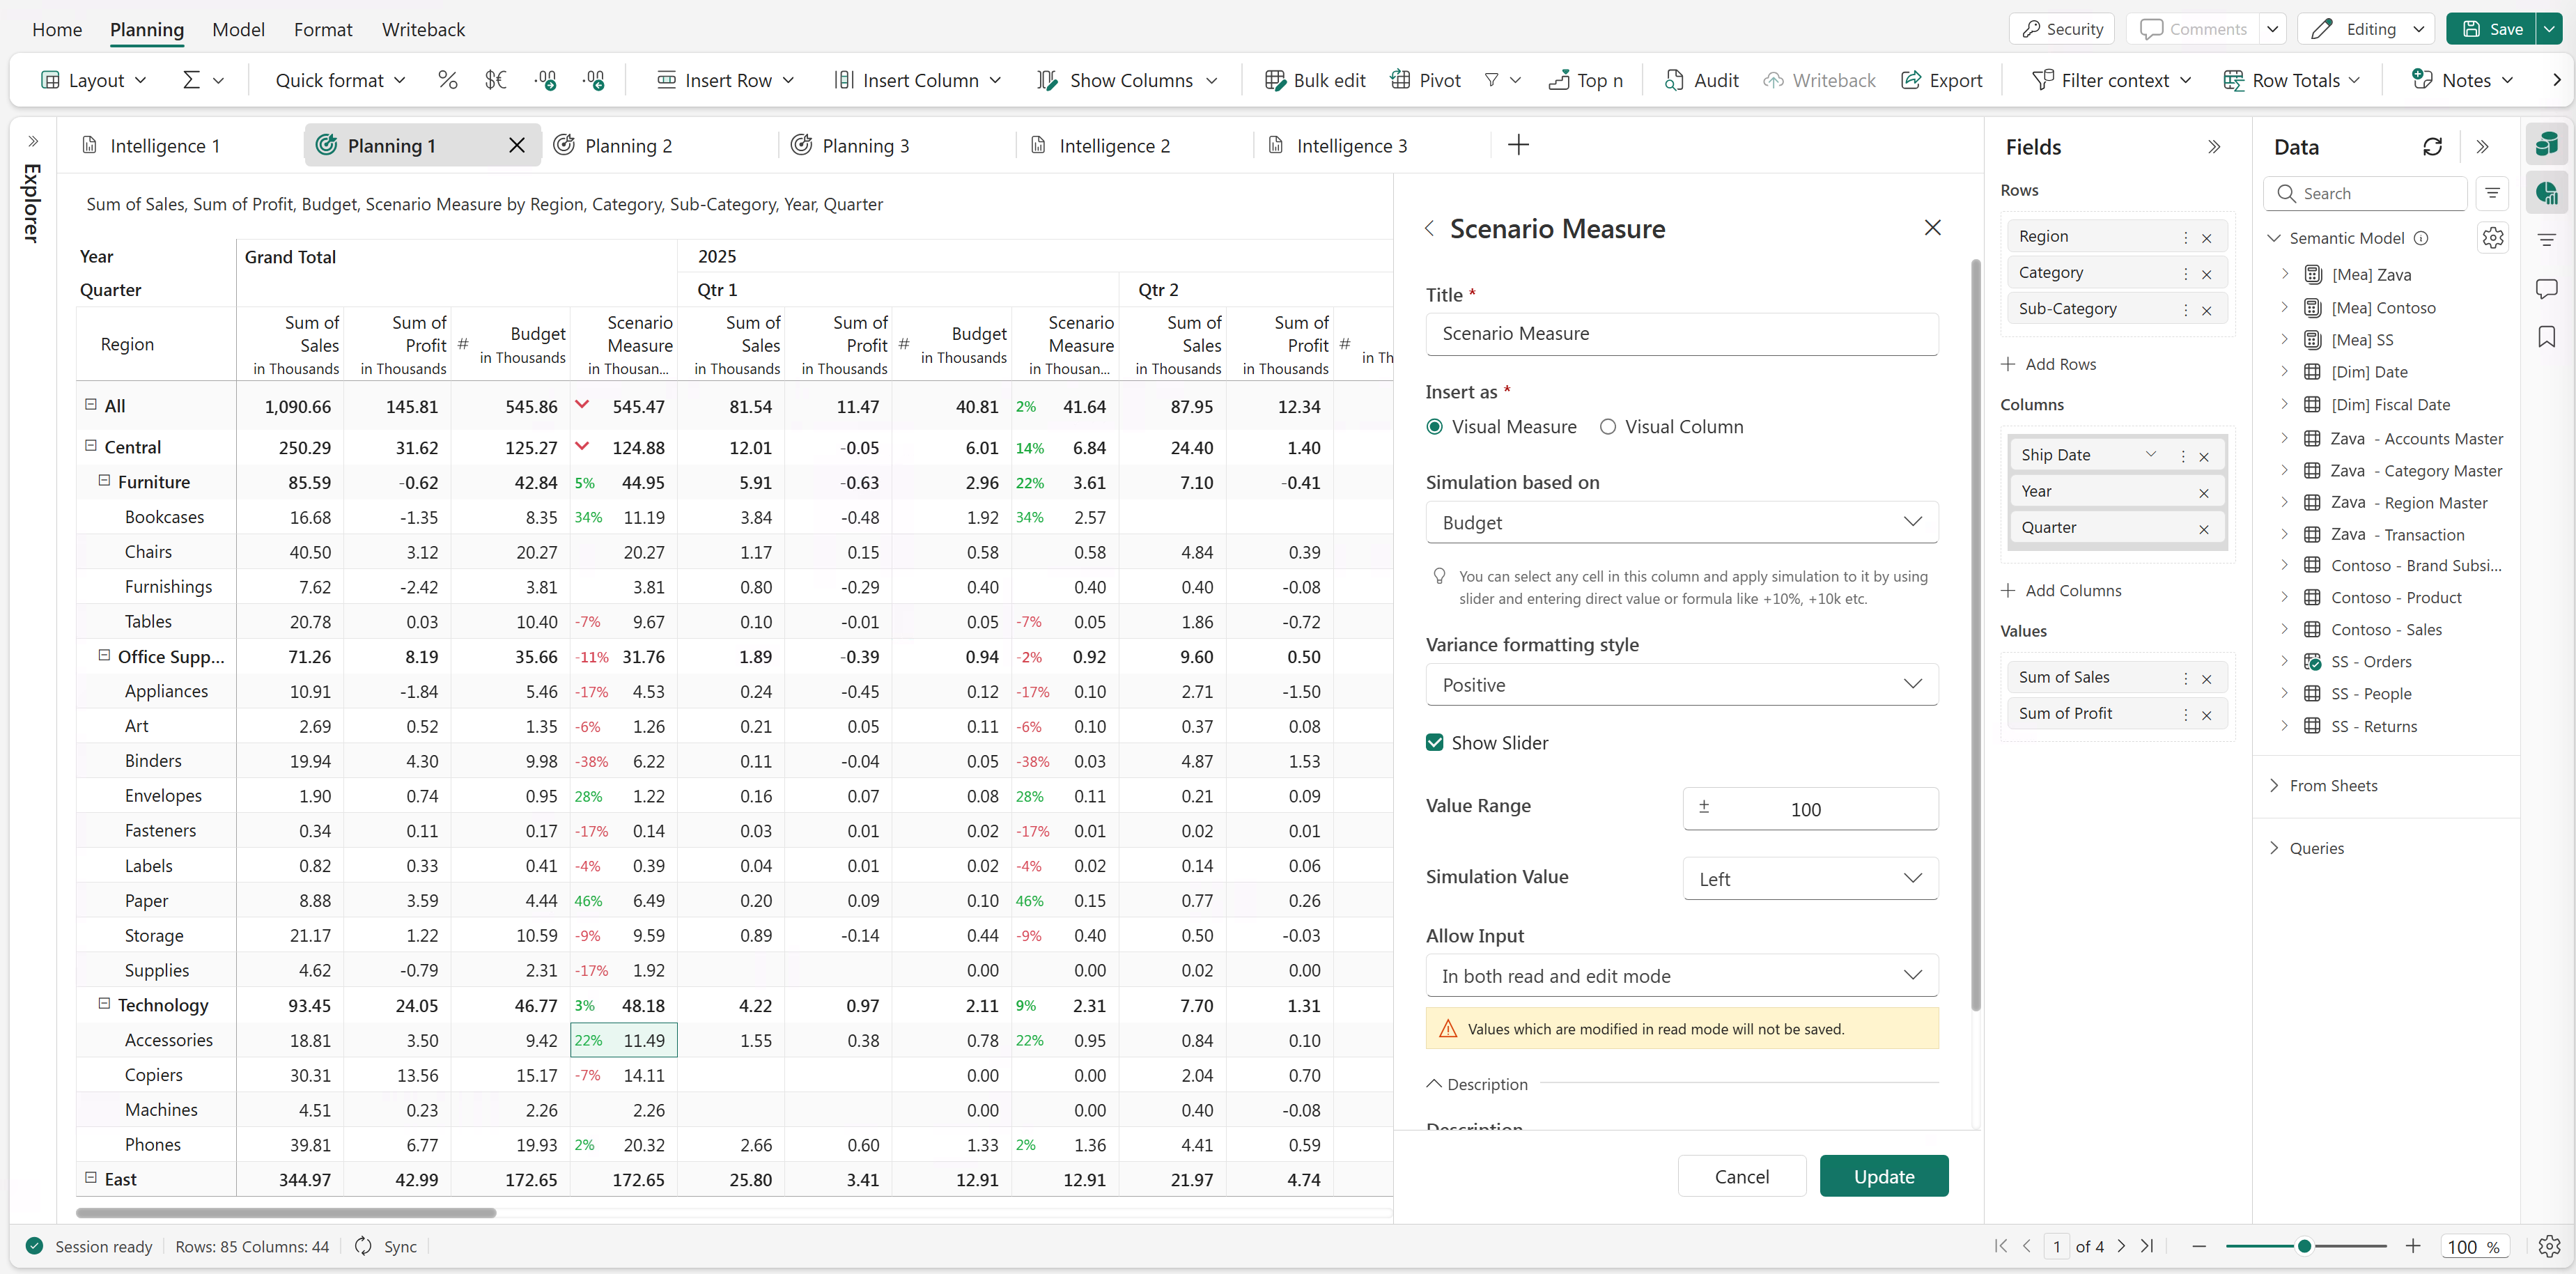
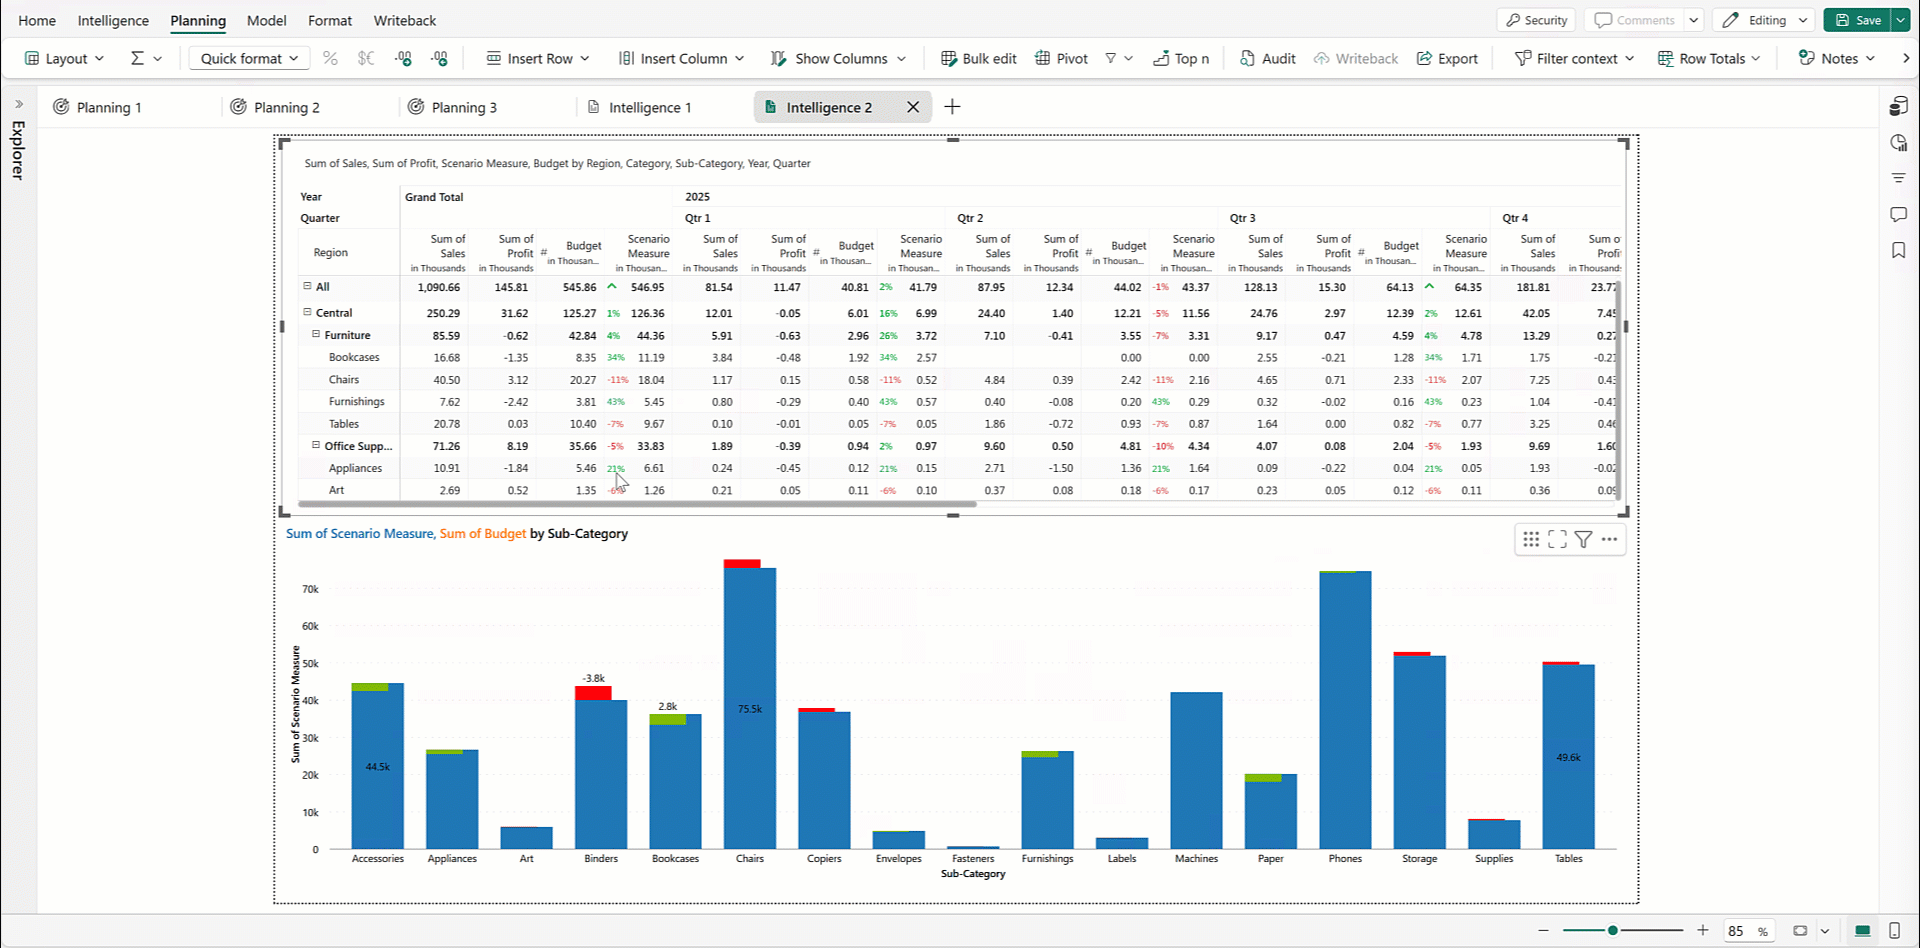
#### Create Planning sheet
1. Create a planning sheet that can contain manual data inputs, simulations, scenarios, and forecasts.
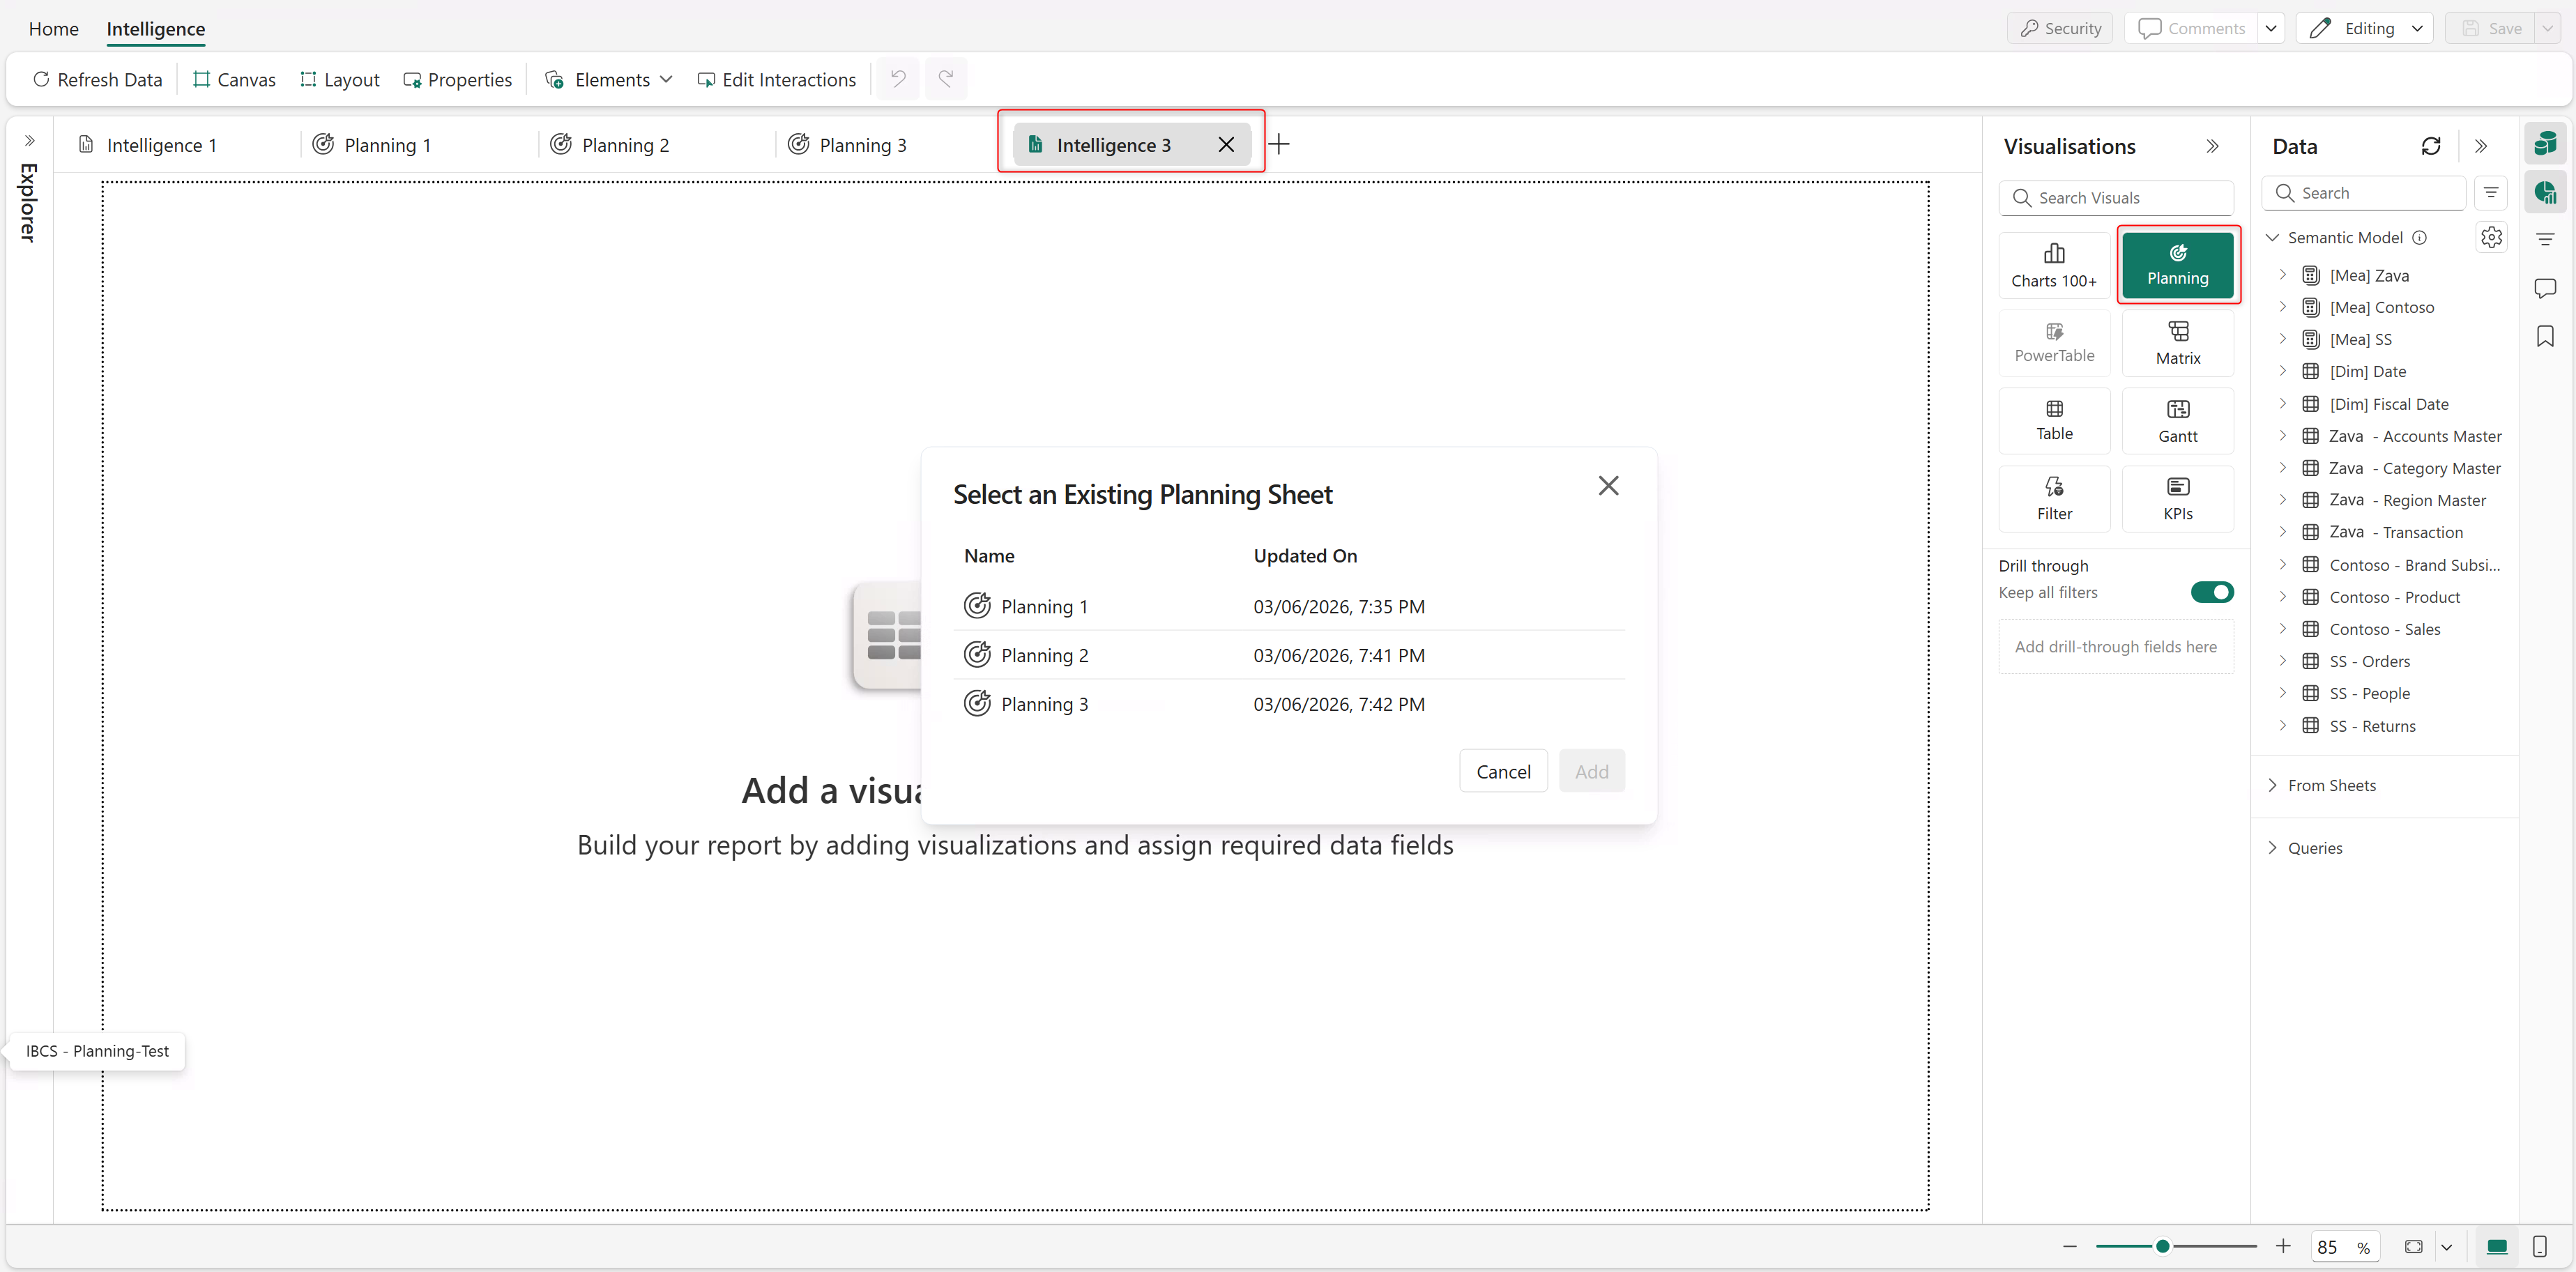
2. In a new Intelligence sheet, select the **Planning** visual and choose the Planning sheet to import data from.
The selected sheet is imported into the Intelligence sheet.
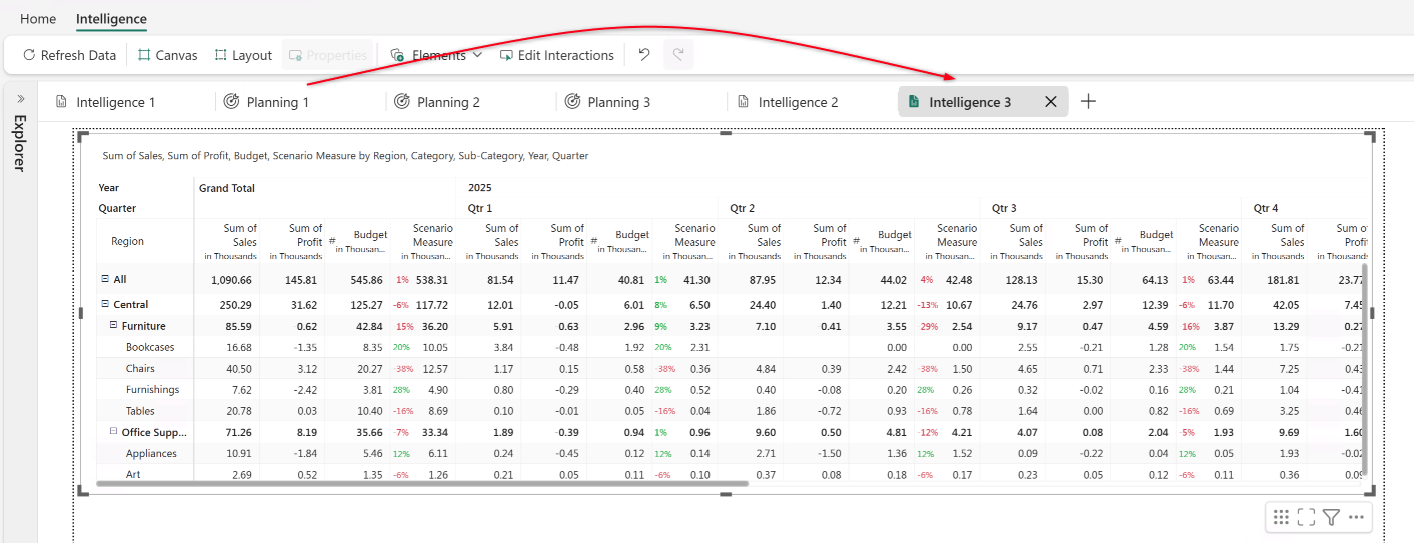
#### Add visuals
1. Add a chart (or a visual that consumes the planning data).
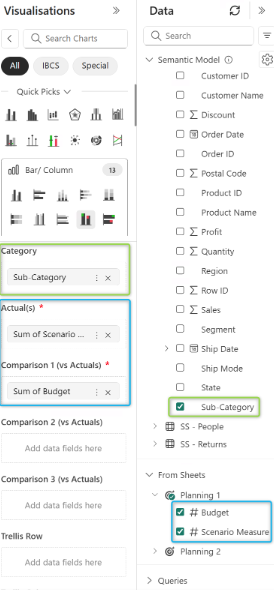
2. Measures from the Planning sheet (data input, formulas, simulations, forecasts) appear as fields under the **From Sheets** section of the **Data** pane. You can assign dimensions and measures from your semantic models and other Planning sheets.
3. As you run simulations in the Planning sheet, the charts in the Intelligence sheet are updated to reflect the changes in real time.
---
# Agent Instructions: Querying This Documentation
If you need additional information that is not directly available in this page, you can query the documentation dynamically by asking a question.
Perform an HTTP GET request on the current page URL with the `ask` query parameter:
```
GET https://docs.fabricplan.com/intelligence-sheets/how-tos/visualize-simulations-budgets-and-forecasts.md?ask=
```
The question should be specific, self-contained, and written in natural language.
The response will contain a direct answer to the question and relevant excerpts and sources from the documentation.
Use this mechanism when the answer is not explicitly present in the current page, you need clarification or additional context, or you want to retrieve related documentation sections.