> For the complete documentation index, see [llms.txt](https://docs.fabricplan.com/llms.txt). Markdown versions of documentation pages are available by appending `.md` to page URLs; this page is available as [Markdown](https://docs.fabricplan.com/intelligence-sheets/how-tos/ranking-data.md).
# Ranking data
Learn how to create Top N rankings in dashboards to highlight best- and worst-performing metrics
### Why ranking is essential for storytelling
{% hint style="success" %}
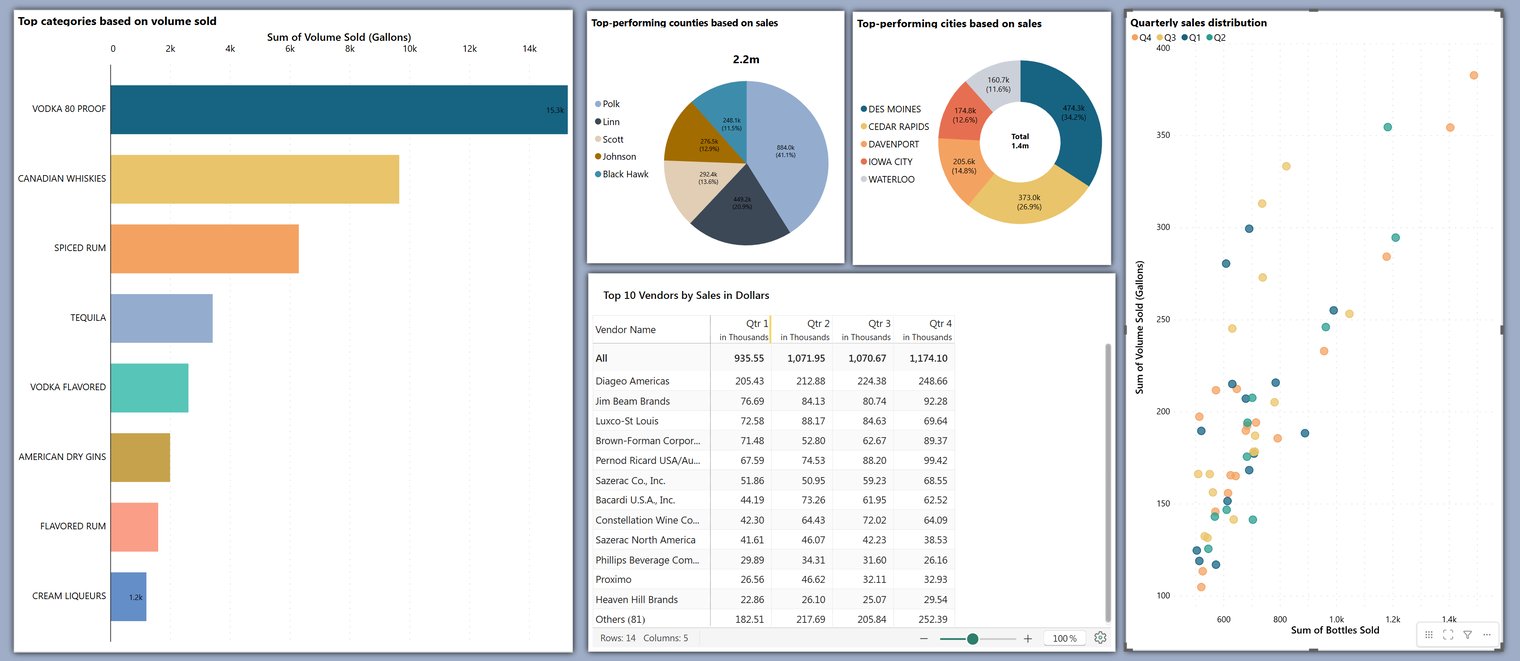
### Ranking spotlights top and bottom performers
* Ranking data derives the most important data points from large datasets.
* Top N ranking makes it easy to compare metrics across, say, regions or products.
* Brings top and bottom performers into focus across charts, KPI cards, and tables in your Fabric dashboards.
{% endhint %}
#### Ranking spotlights top and bottom performers
* Ranking data derives the most important data points from large datasets.
* Top N ranking makes it easy to compare metrics across, say, regions or products.
* Brings top and bottom performers into focus across charts, KPI cards, and tables in your Fabric dashboards.
### Configure ranking in charts
1. Click the TopN option from the toolbar
2. Display the top or bottom performing categories
3. Rank by percentage or measure value and specify the number of items to show.
4. Choose to club the remaining items and display them as a single category.
### Ranking axis categories in charts
Configure ranking from the **Axis** tab. All categories are plotted when **Display** is set to **Off**.
Define the number of categories to display the highest or lowest contributors.
### Row and column ranking
You can rank based on rows or columns for charts and tables in trellis mode. The Top N interface has a row and column tab for trellises. Follow the steps outlined in the setup section in each of these tabs.
Let's use TopN ranking to find the regions and product categories with the least sales.
The top or bottom performing categories are rendered.
### Ranking for stacked charts
Apply Top N ranking to stacked charts to display only the top or bottom performing categories. The steps outlined in the setup section can be applied in the **Stacked** tab. The images show how ranking can be used to display the top-performing stacked categories.
Apply ranking from the **Stacked** tab.
Best performing segments are rendered:
---
# Agent Instructions
This documentation is published with GitBook. GitBook is the documentation platform designed so that both humans and AI agents can read, navigate, and reason over technical content effectively. Learn more at gitbook.com.
## Querying This Documentation
If you need additional information that is not directly available in this page, you can query the documentation dynamically by asking a question.
Perform an HTTP GET request on the current page URL with the `ask` query parameter, and the optional `goal` query parameter:
```
GET https://docs.fabricplan.com/intelligence-sheets/how-tos/ranking-data.md?ask=&goal=
```
`ask` is the immediate question: it should be specific, self-contained, and written in natural language.
`goal` is optional and describes the broader end goal you are ultimately trying to accomplish on behalf of the user. GitBook uses it to tailor the answer towards what is most useful for that goal.
The response will contain a direct answer to the question and relevant excerpts and sources from the documentation.
Use this mechanism when the answer is not explicitly present in the current page, you need clarification or additional context, or you want to retrieve related documentation sections.