# Plan projects with Gantt charts
The Intelligence sheet features a best-in-class Gantt chart for Fabric that helps visualize, communicate, and track project progress. The fully customizable Gantt chart enables you to:
* Plan projects by breaking work into tasks with defined start and end dates.
* Identify task dependencies and anticipate potential delays.
* Assign resources to tasks and balance workloads across teams.
* Track key deliverables, approvals, and project milestones.
Important
This feature is in preview.
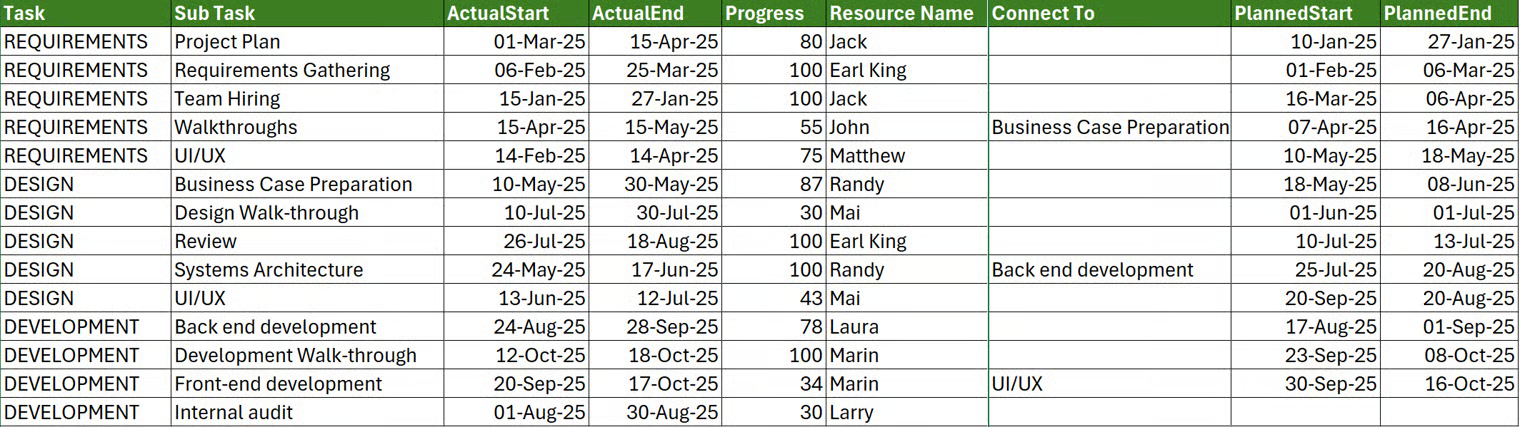
#### Sample data
The data used to plot the Gantt chart in this article is shown in the following table.
#### Configure Gantt charts
Follow these steps to build a Gantt chart:
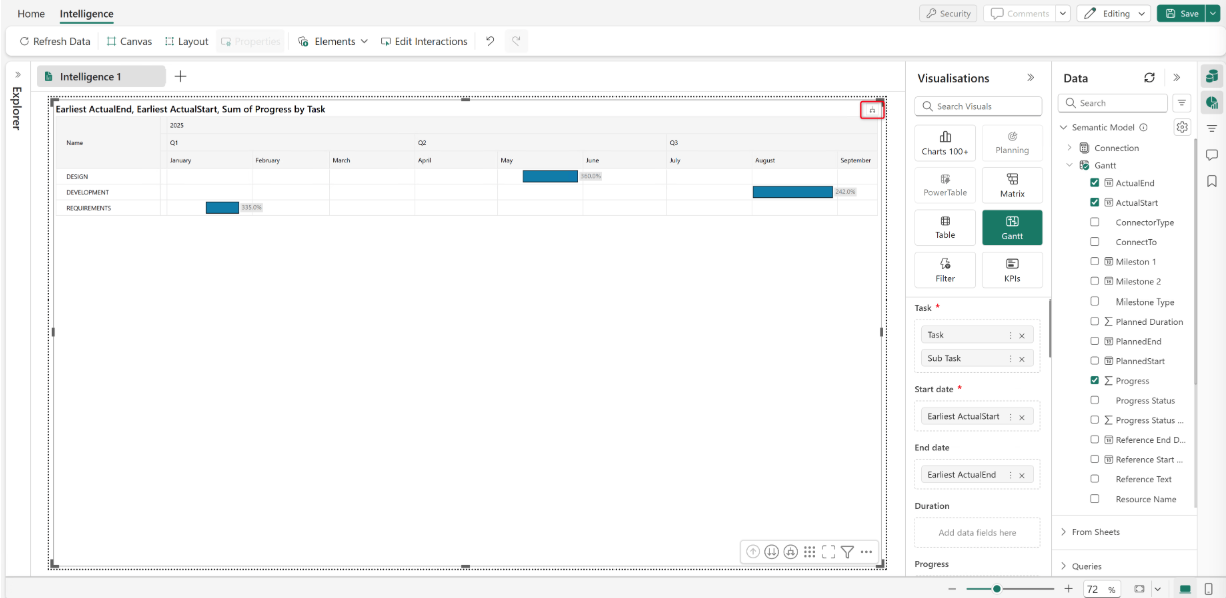
1. Add the Gantt visual to the canvas.
2. Assign data to the **Task**, **Start Date**, **End Date**, and **Progress** fields.
3. Select the drill down icon to display the task breakdown.
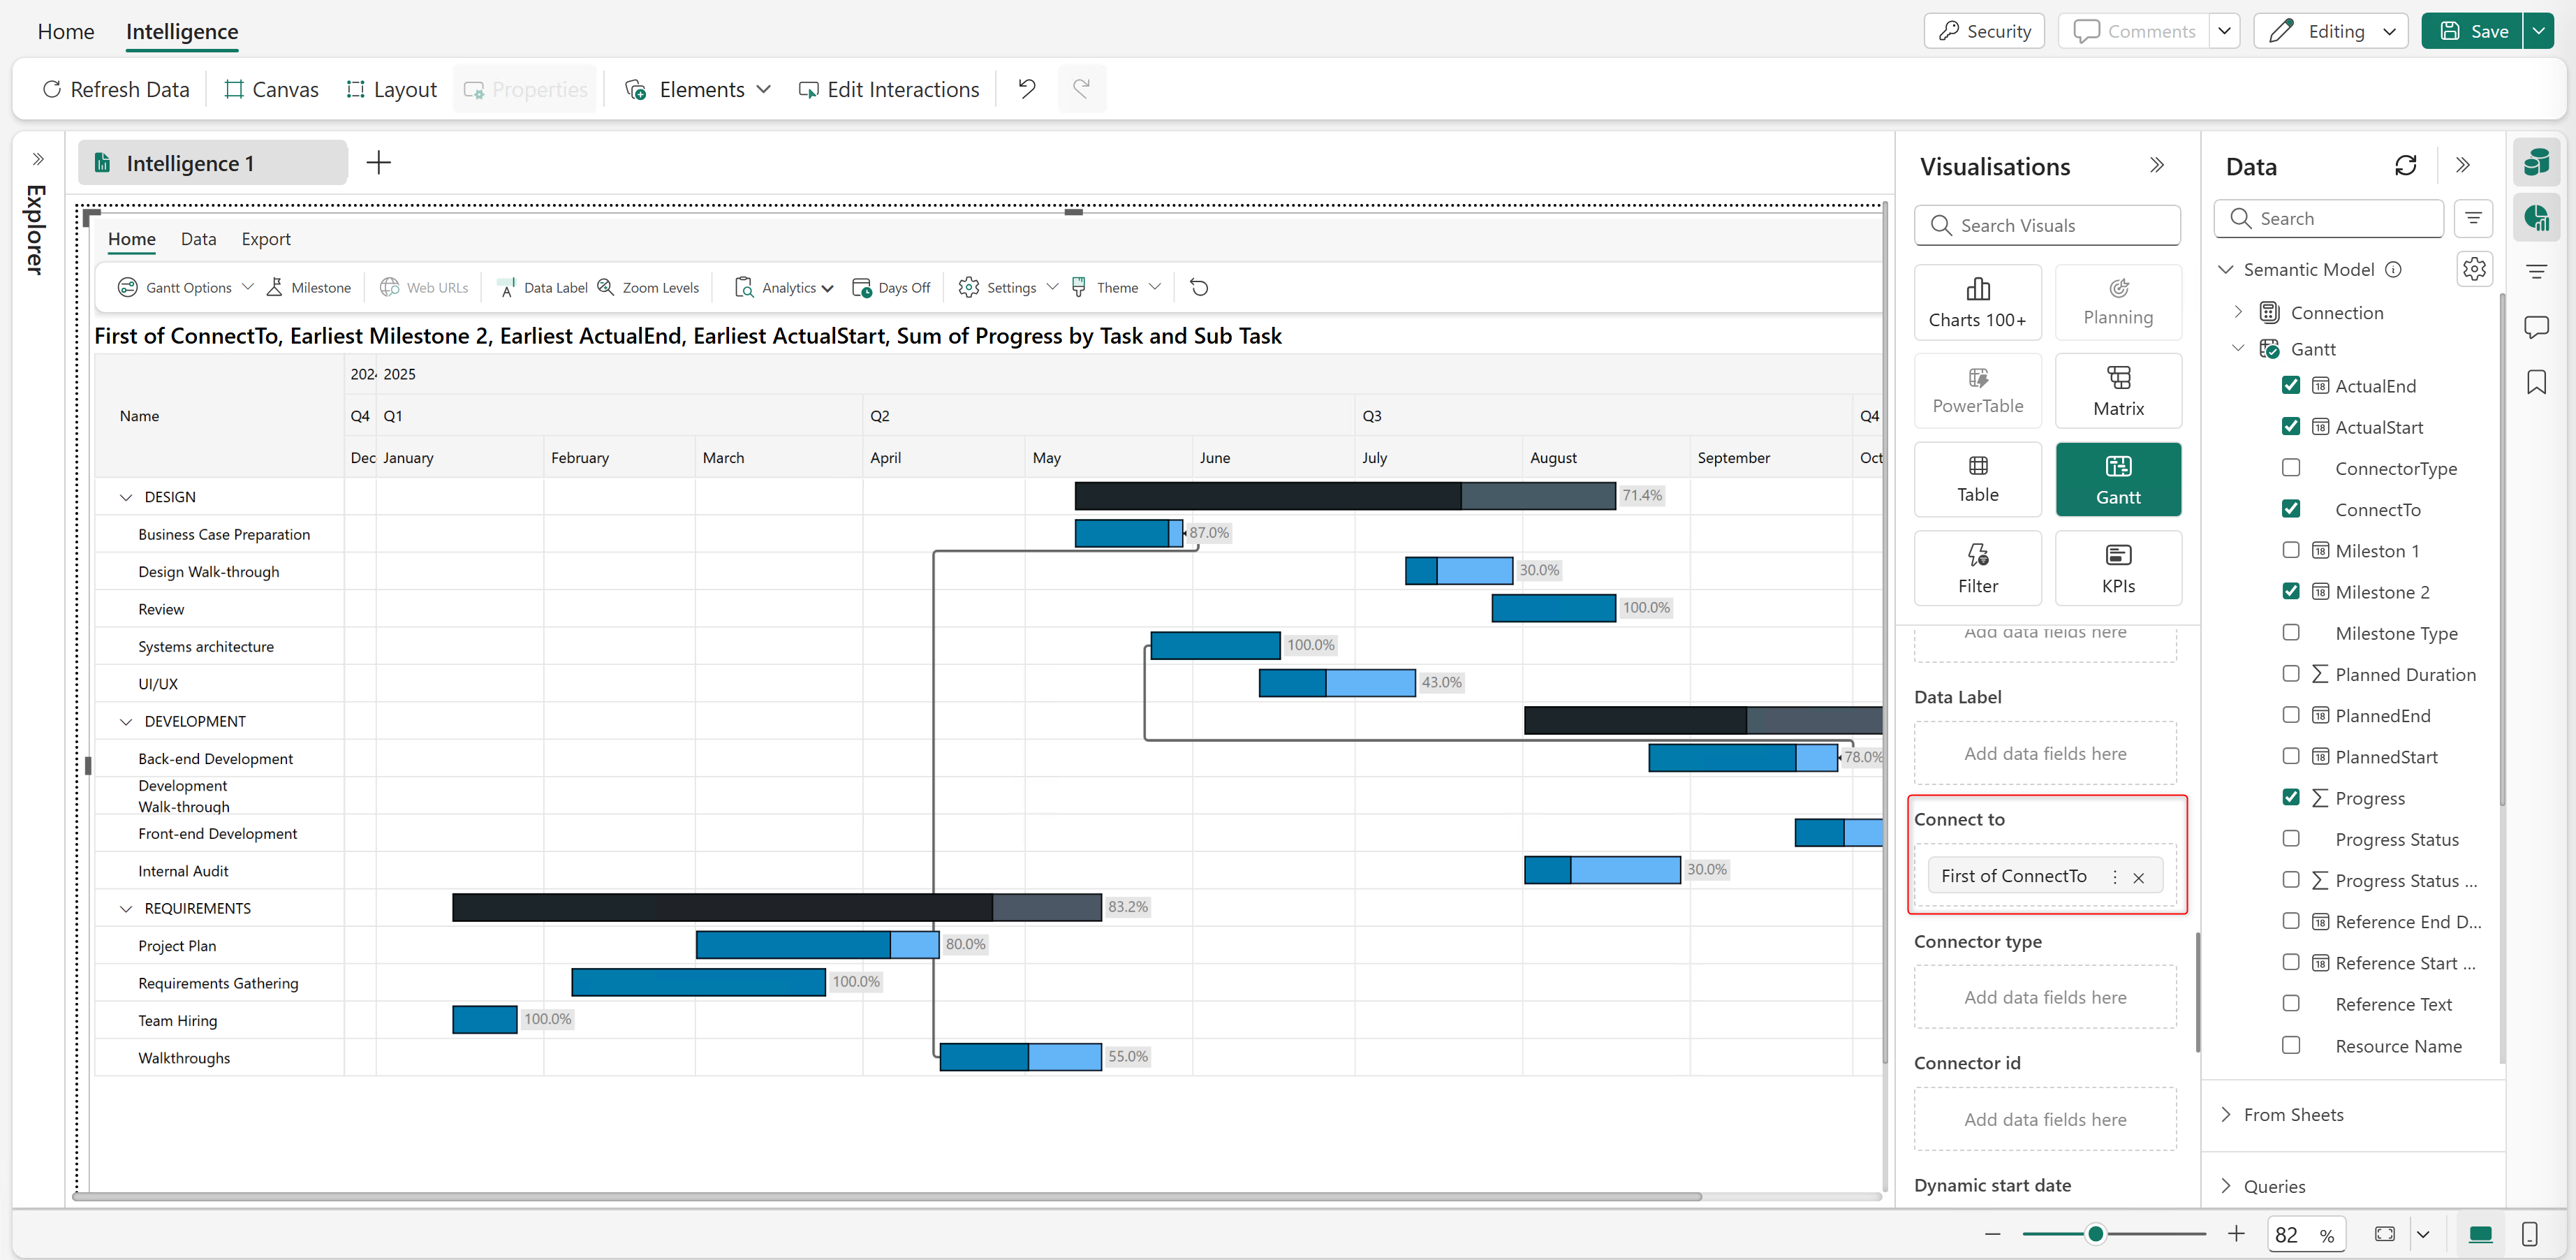
4. Assign the field that captures dependencies to the **Connect to** bucket. You see connector lines rendered between tasks that have dependencies.
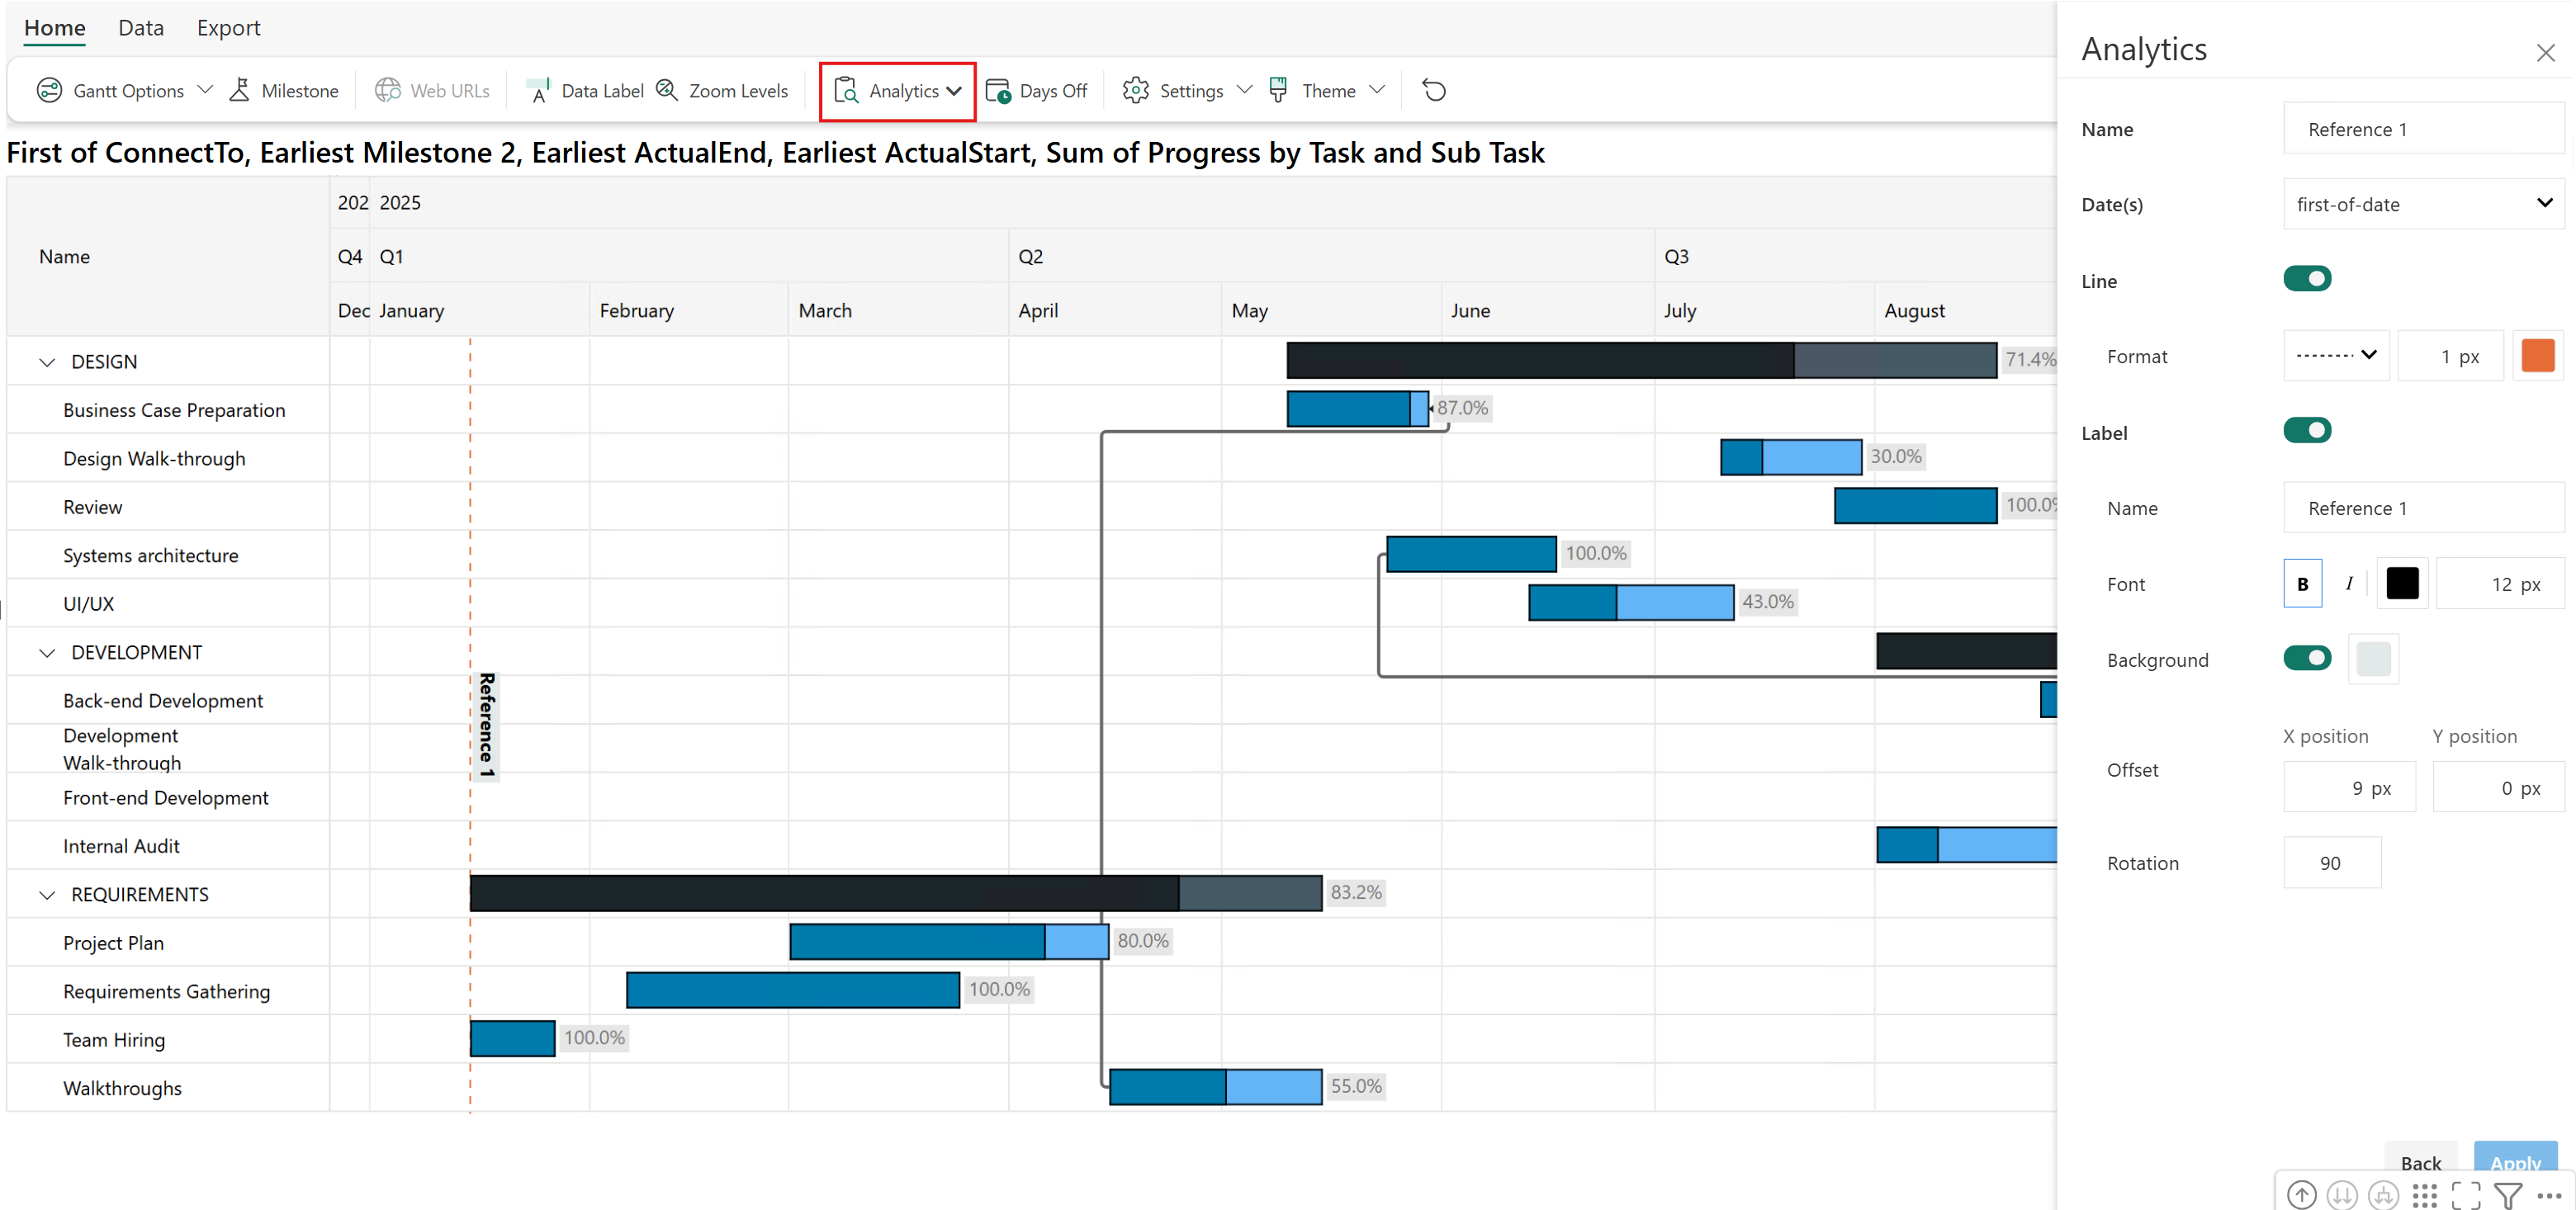
5. Select the **Analytics** option and **Add new reference**. Capture phases or project sprints with reference lines or reference bands.
6. Set **Date(s)** to *first-of-date*. Change the **Name** and **Label** to *Project kick off*.
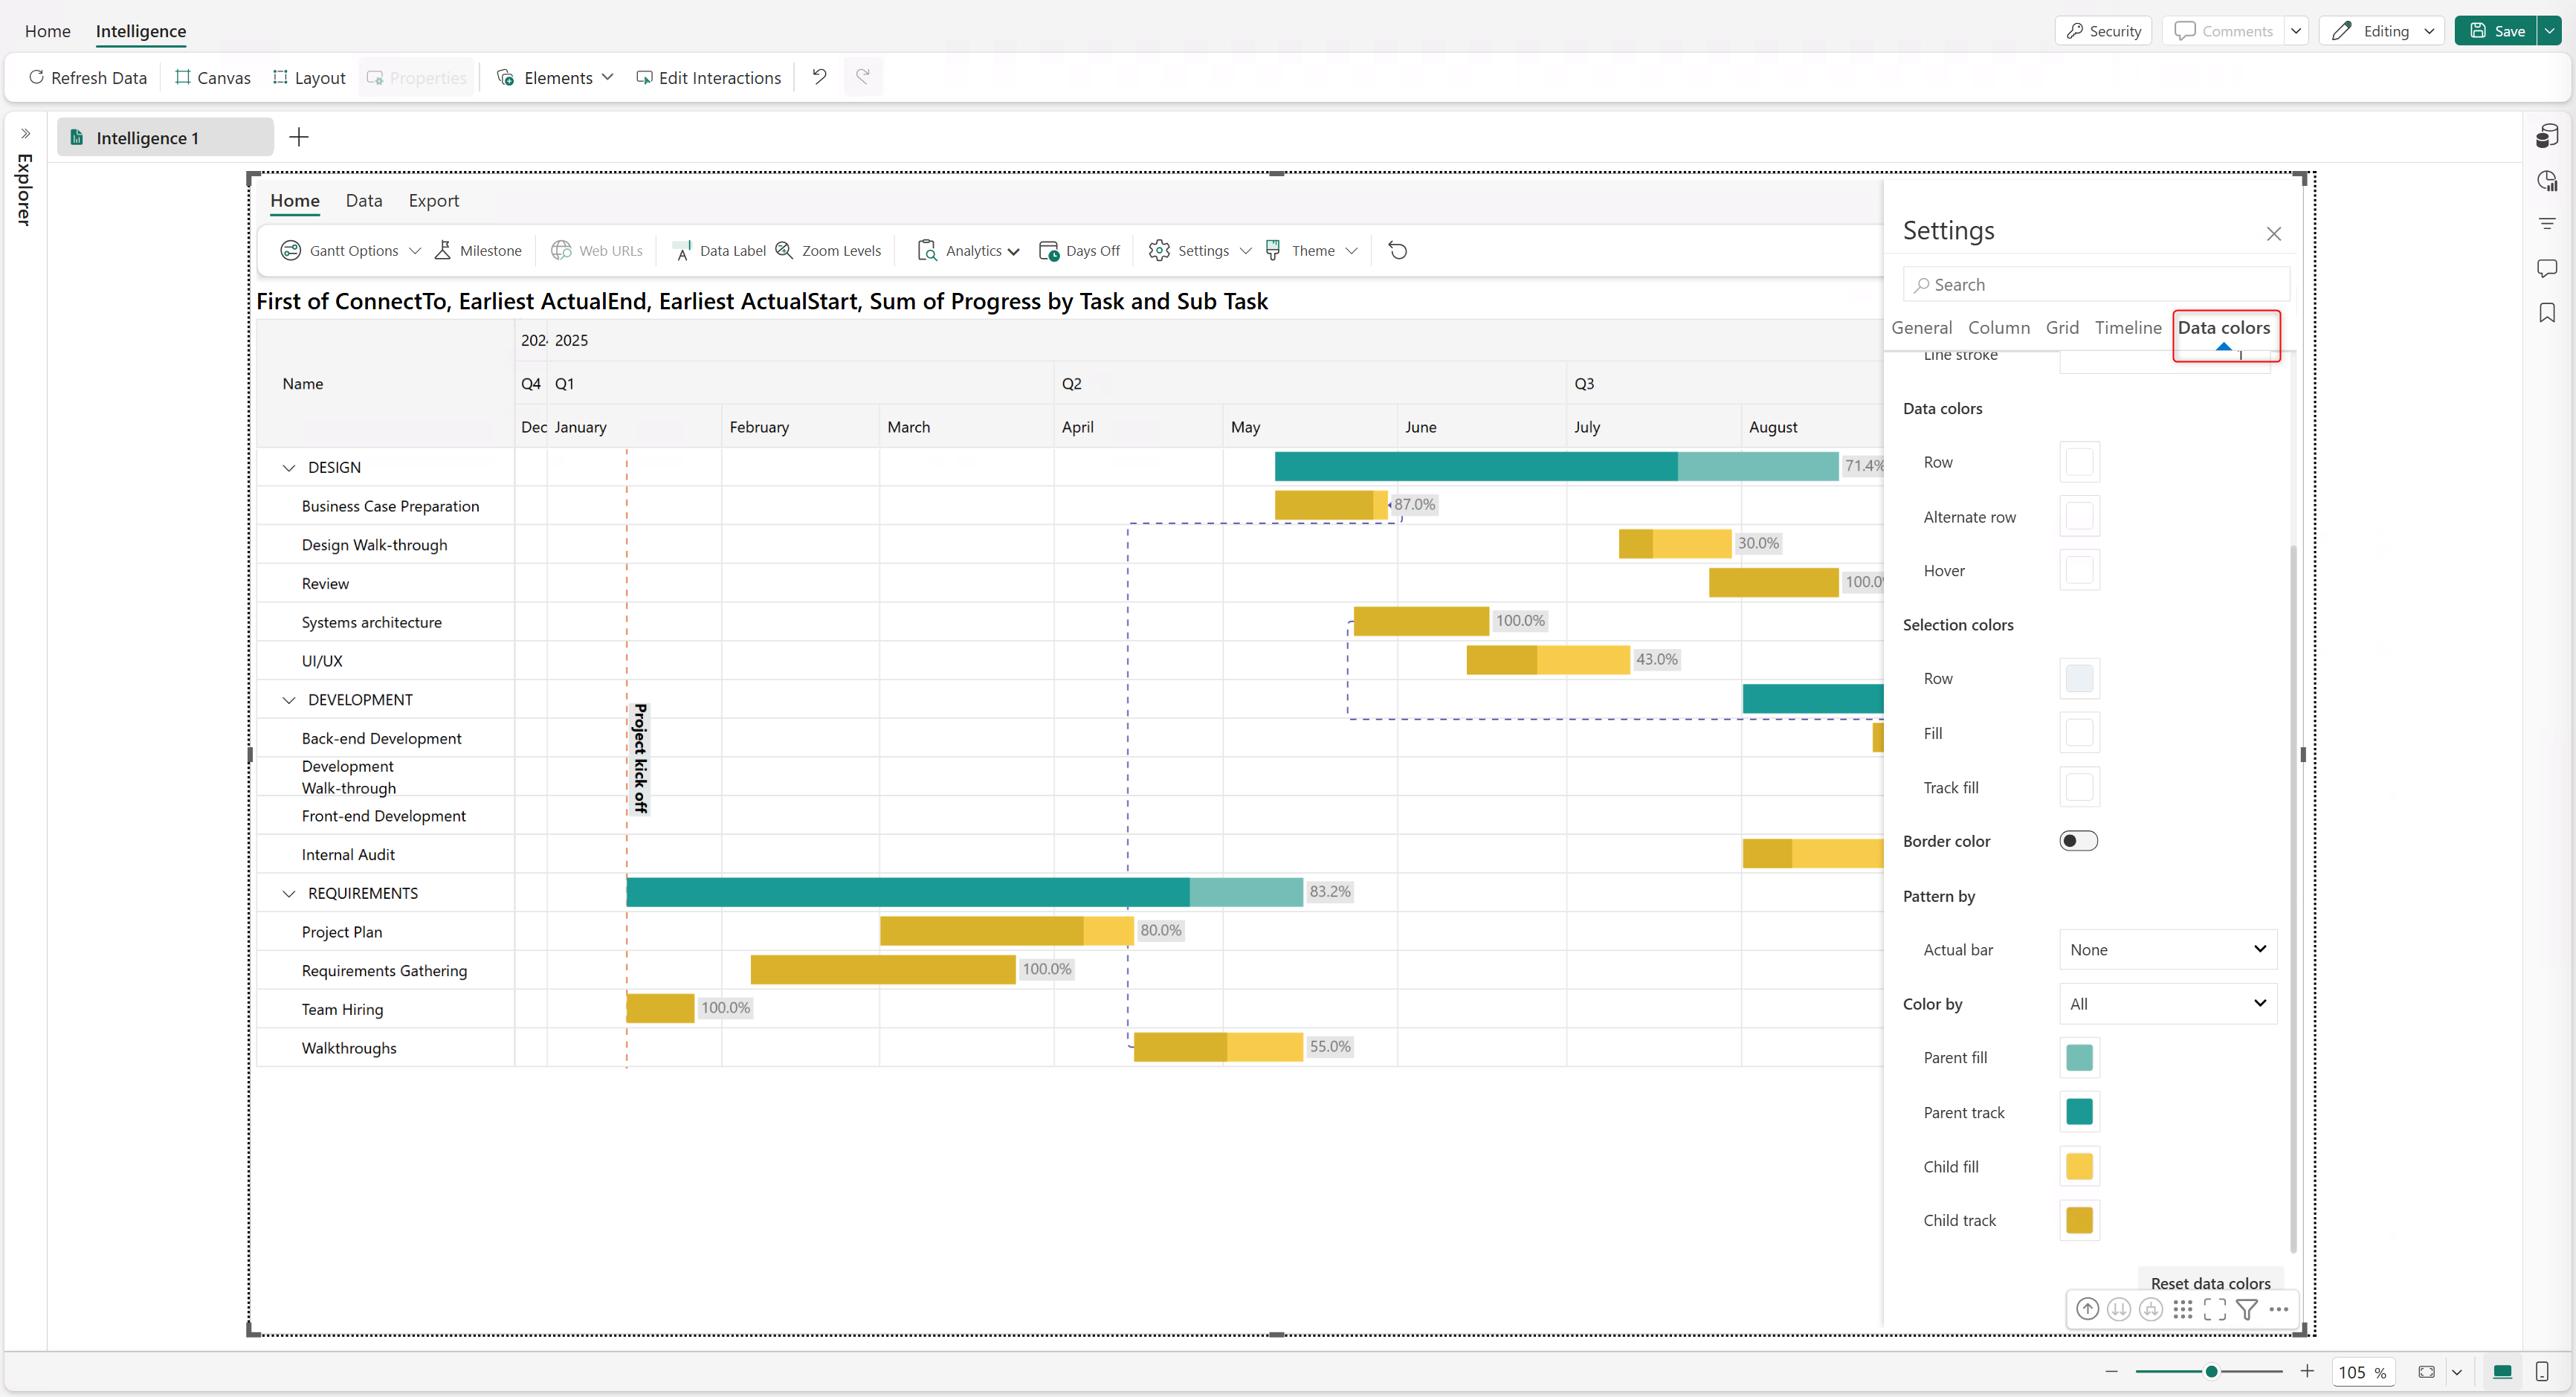
7. Change the line format to a dashed line. Select **Apply**. The chart should look like the following image:
8. Select **Gantt Options > Data colors** to customize the colors, style, and border of the progress bars. You can also change the appearance of the connector lines.
---
# Agent Instructions: Querying This Documentation
If you need additional information that is not directly available in this page, you can query the documentation dynamically by asking a question.
Perform an HTTP GET request on the current page URL with the `ask` query parameter:
```
GET https://docs.fabricplan.com/intelligence-sheets/how-tos/plan-projects-with-gantt-charts.md?ask=
```
The question should be specific, self-contained, and written in natural language.
The response will contain a direct answer to the question and relevant excerpts and sources from the documentation.
Use this mechanism when the answer is not explicitly present in the current page, you need clarification or additional context, or you want to retrieve related documentation sections.