# Export high-quality PDF & Excel reports
Export reports and dashboards as high-quality files while preserving layout and formatting. Export options allow you to:
* Export charts, tables, and dashboards as **PDF or PNG** files.
* Preserve report formatting, including fonts, colors, spacing, and layout.
* Select the quality and page size.
Important
This feature is in preview.
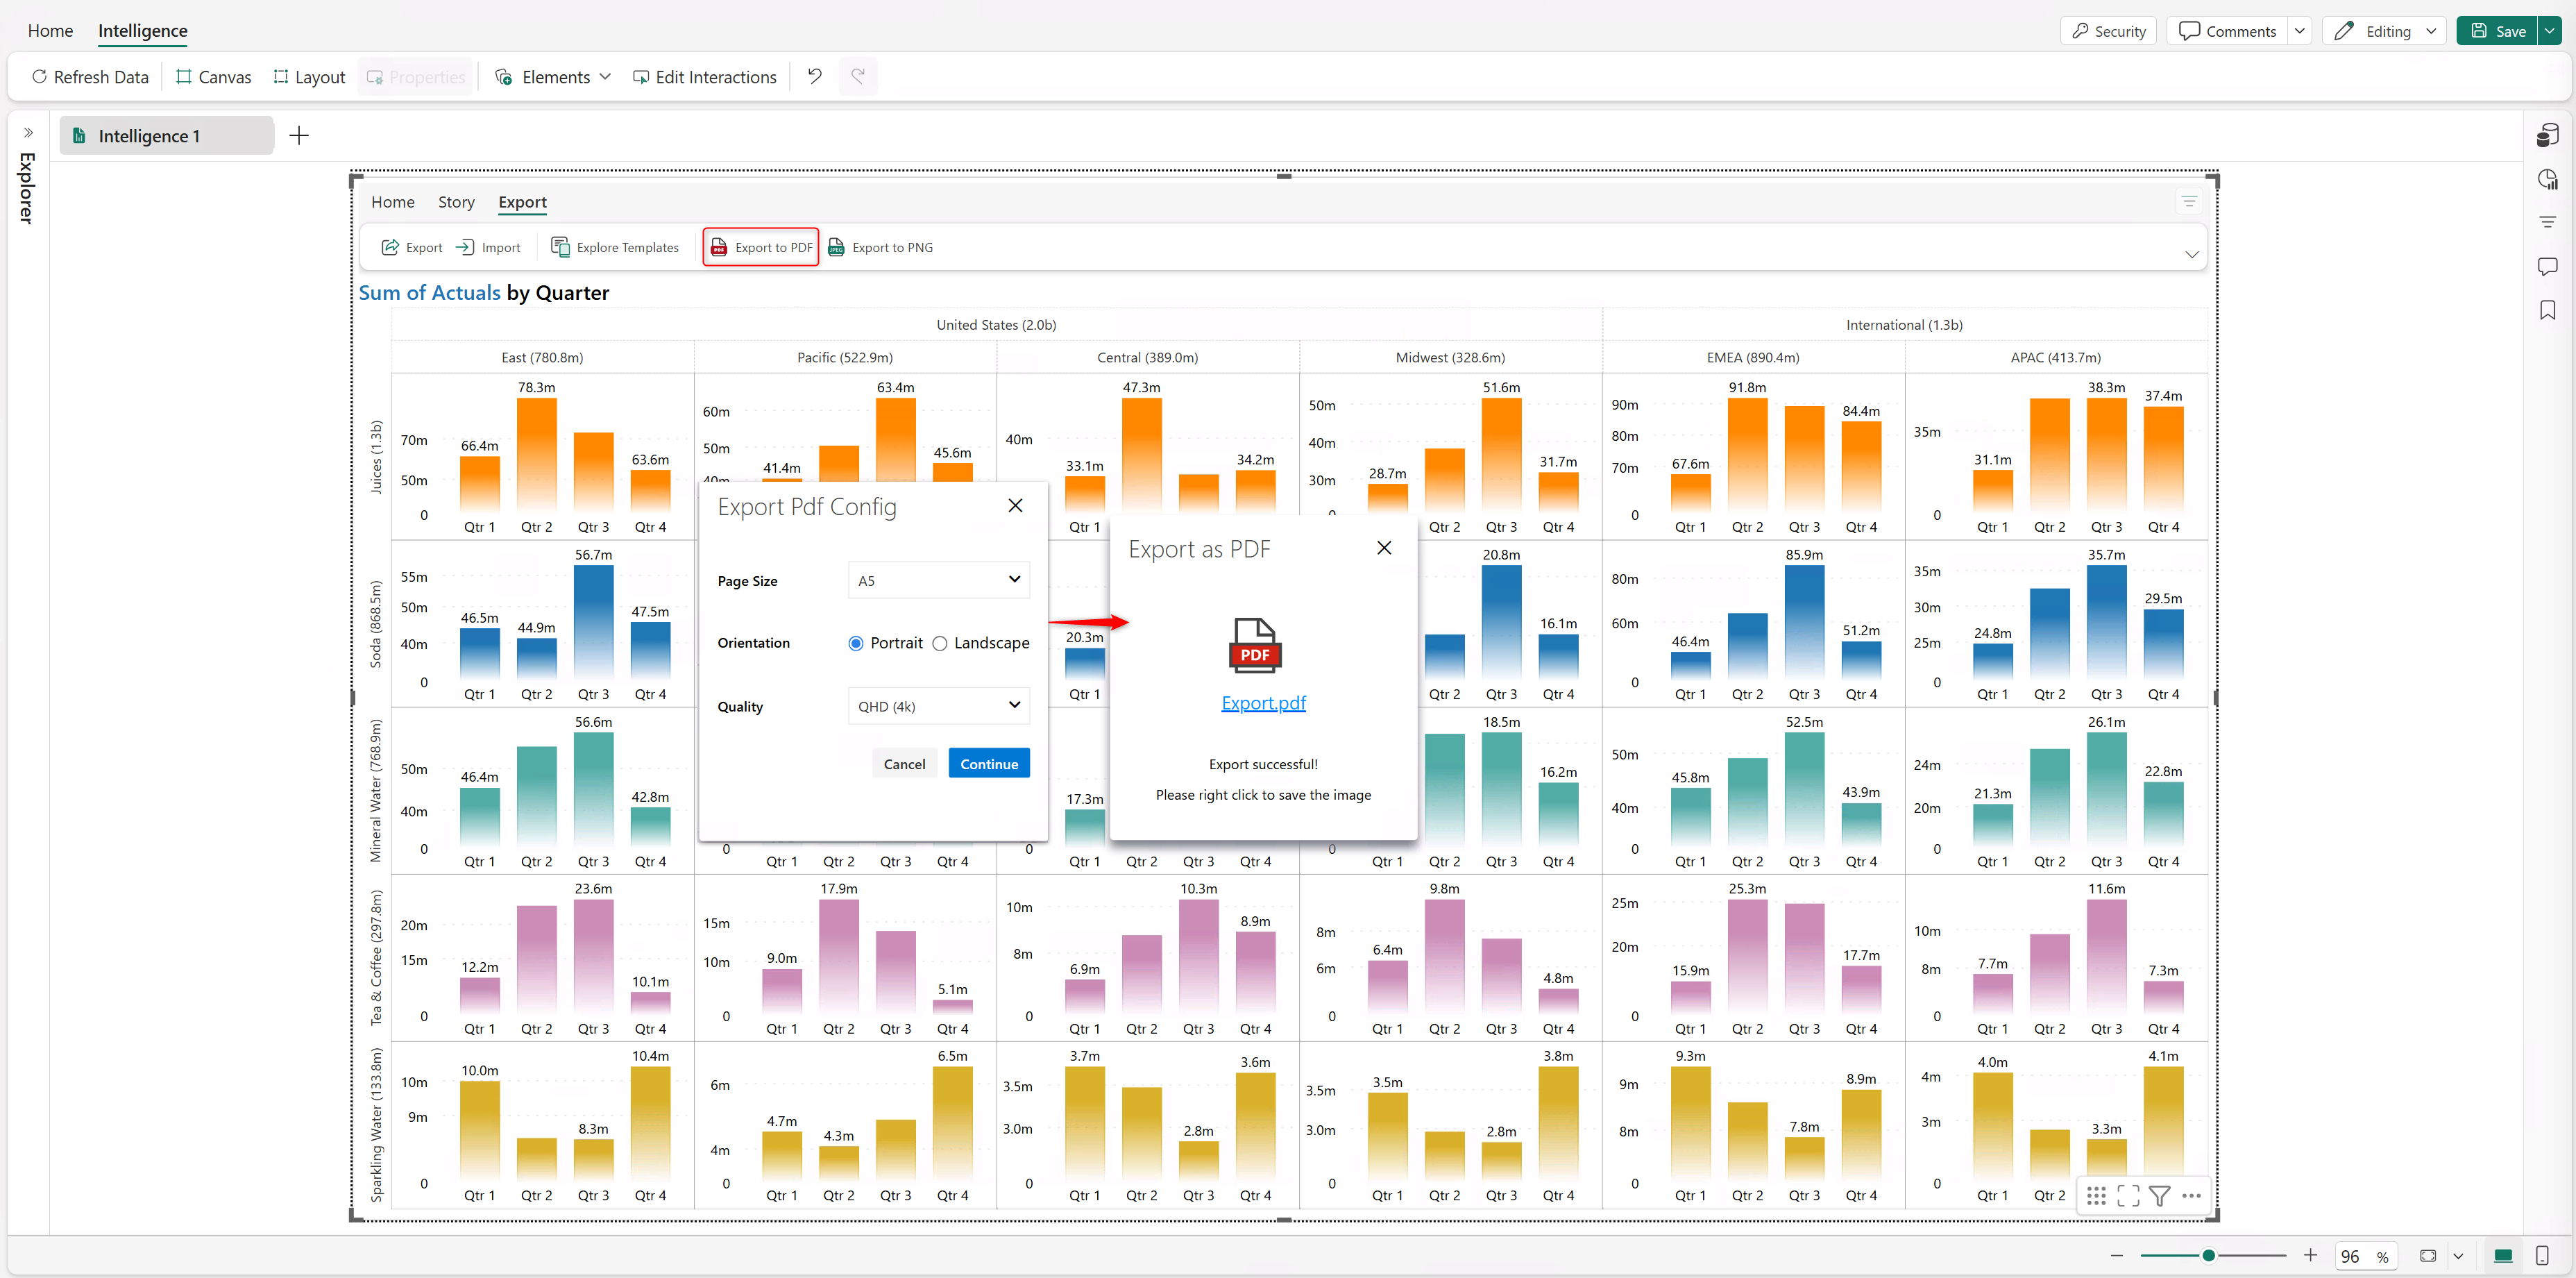
#### Export to PDF
Charts and KPI cards can be exported to PDF or PNG files.
1. Select **Export to PDF**.
2. Set the **Page Size**.
3. Choose **Landscape** or **Portrait** orientation.
4. Select the export resolution (4K/1080p/720p).
5. Select the link to download the PDF file.
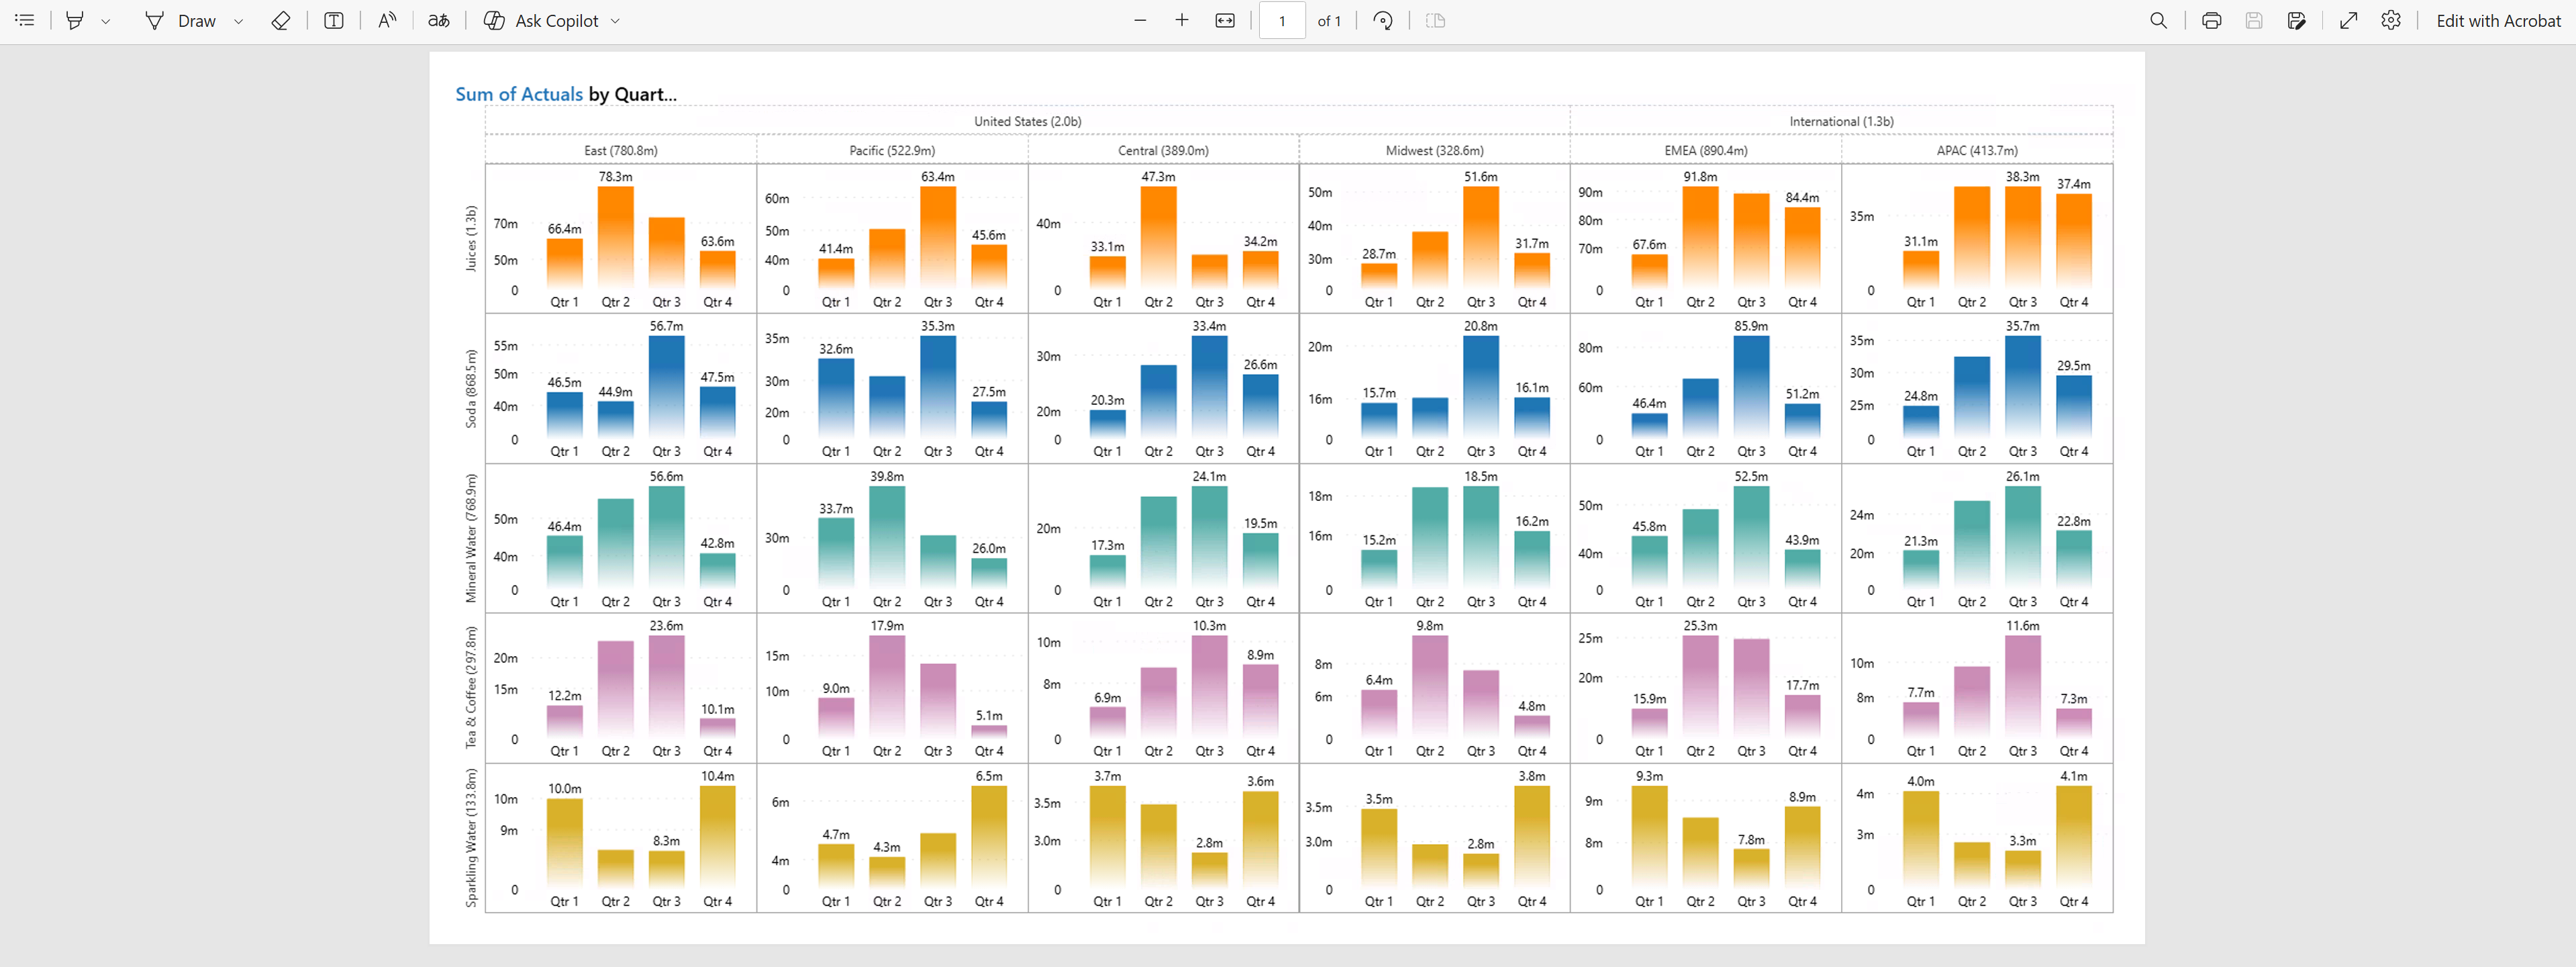
The following image shows a sample PDF export:
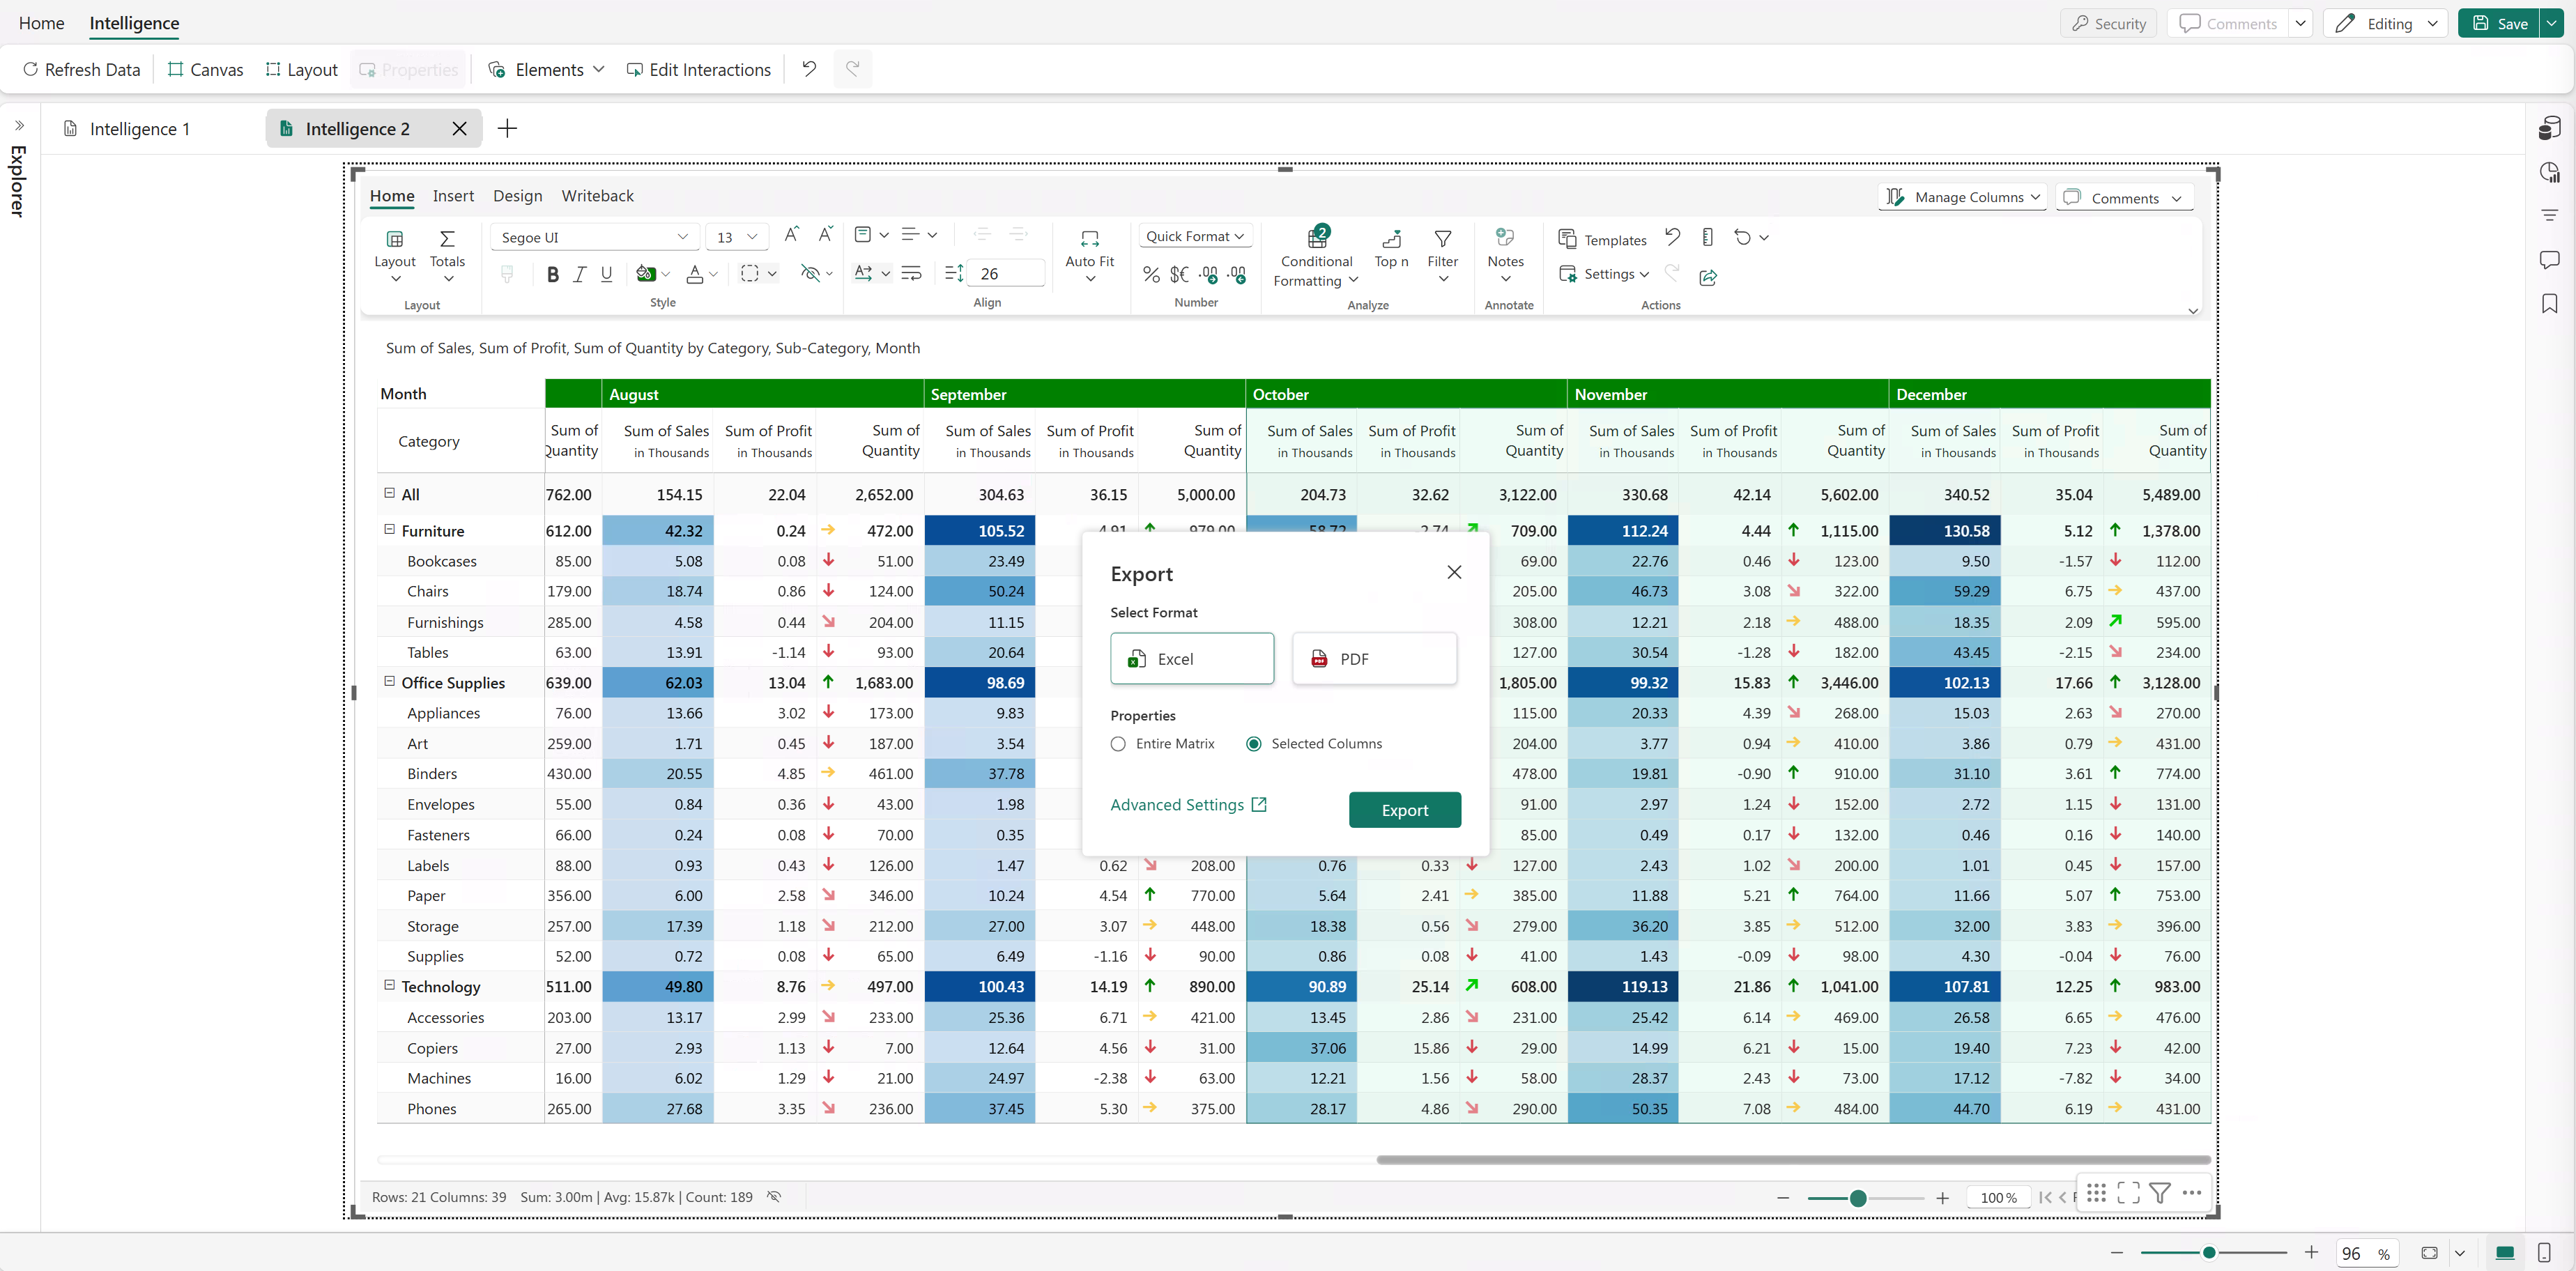
#### Export to Excel
Tabular reports can be exported to Excel with fully preserved conditional formatting.
1. Select the columns in your report to export only those columns. By default, the entire matrix is exported.
2. Select the **Export** icon on the **Home** tab of the menu ribbon.
3. Select **Excel** format.
4. Choose **Selected Columns** (this exports a portion of the report).
5. Click **Export**.
6. To download the file, select the link.
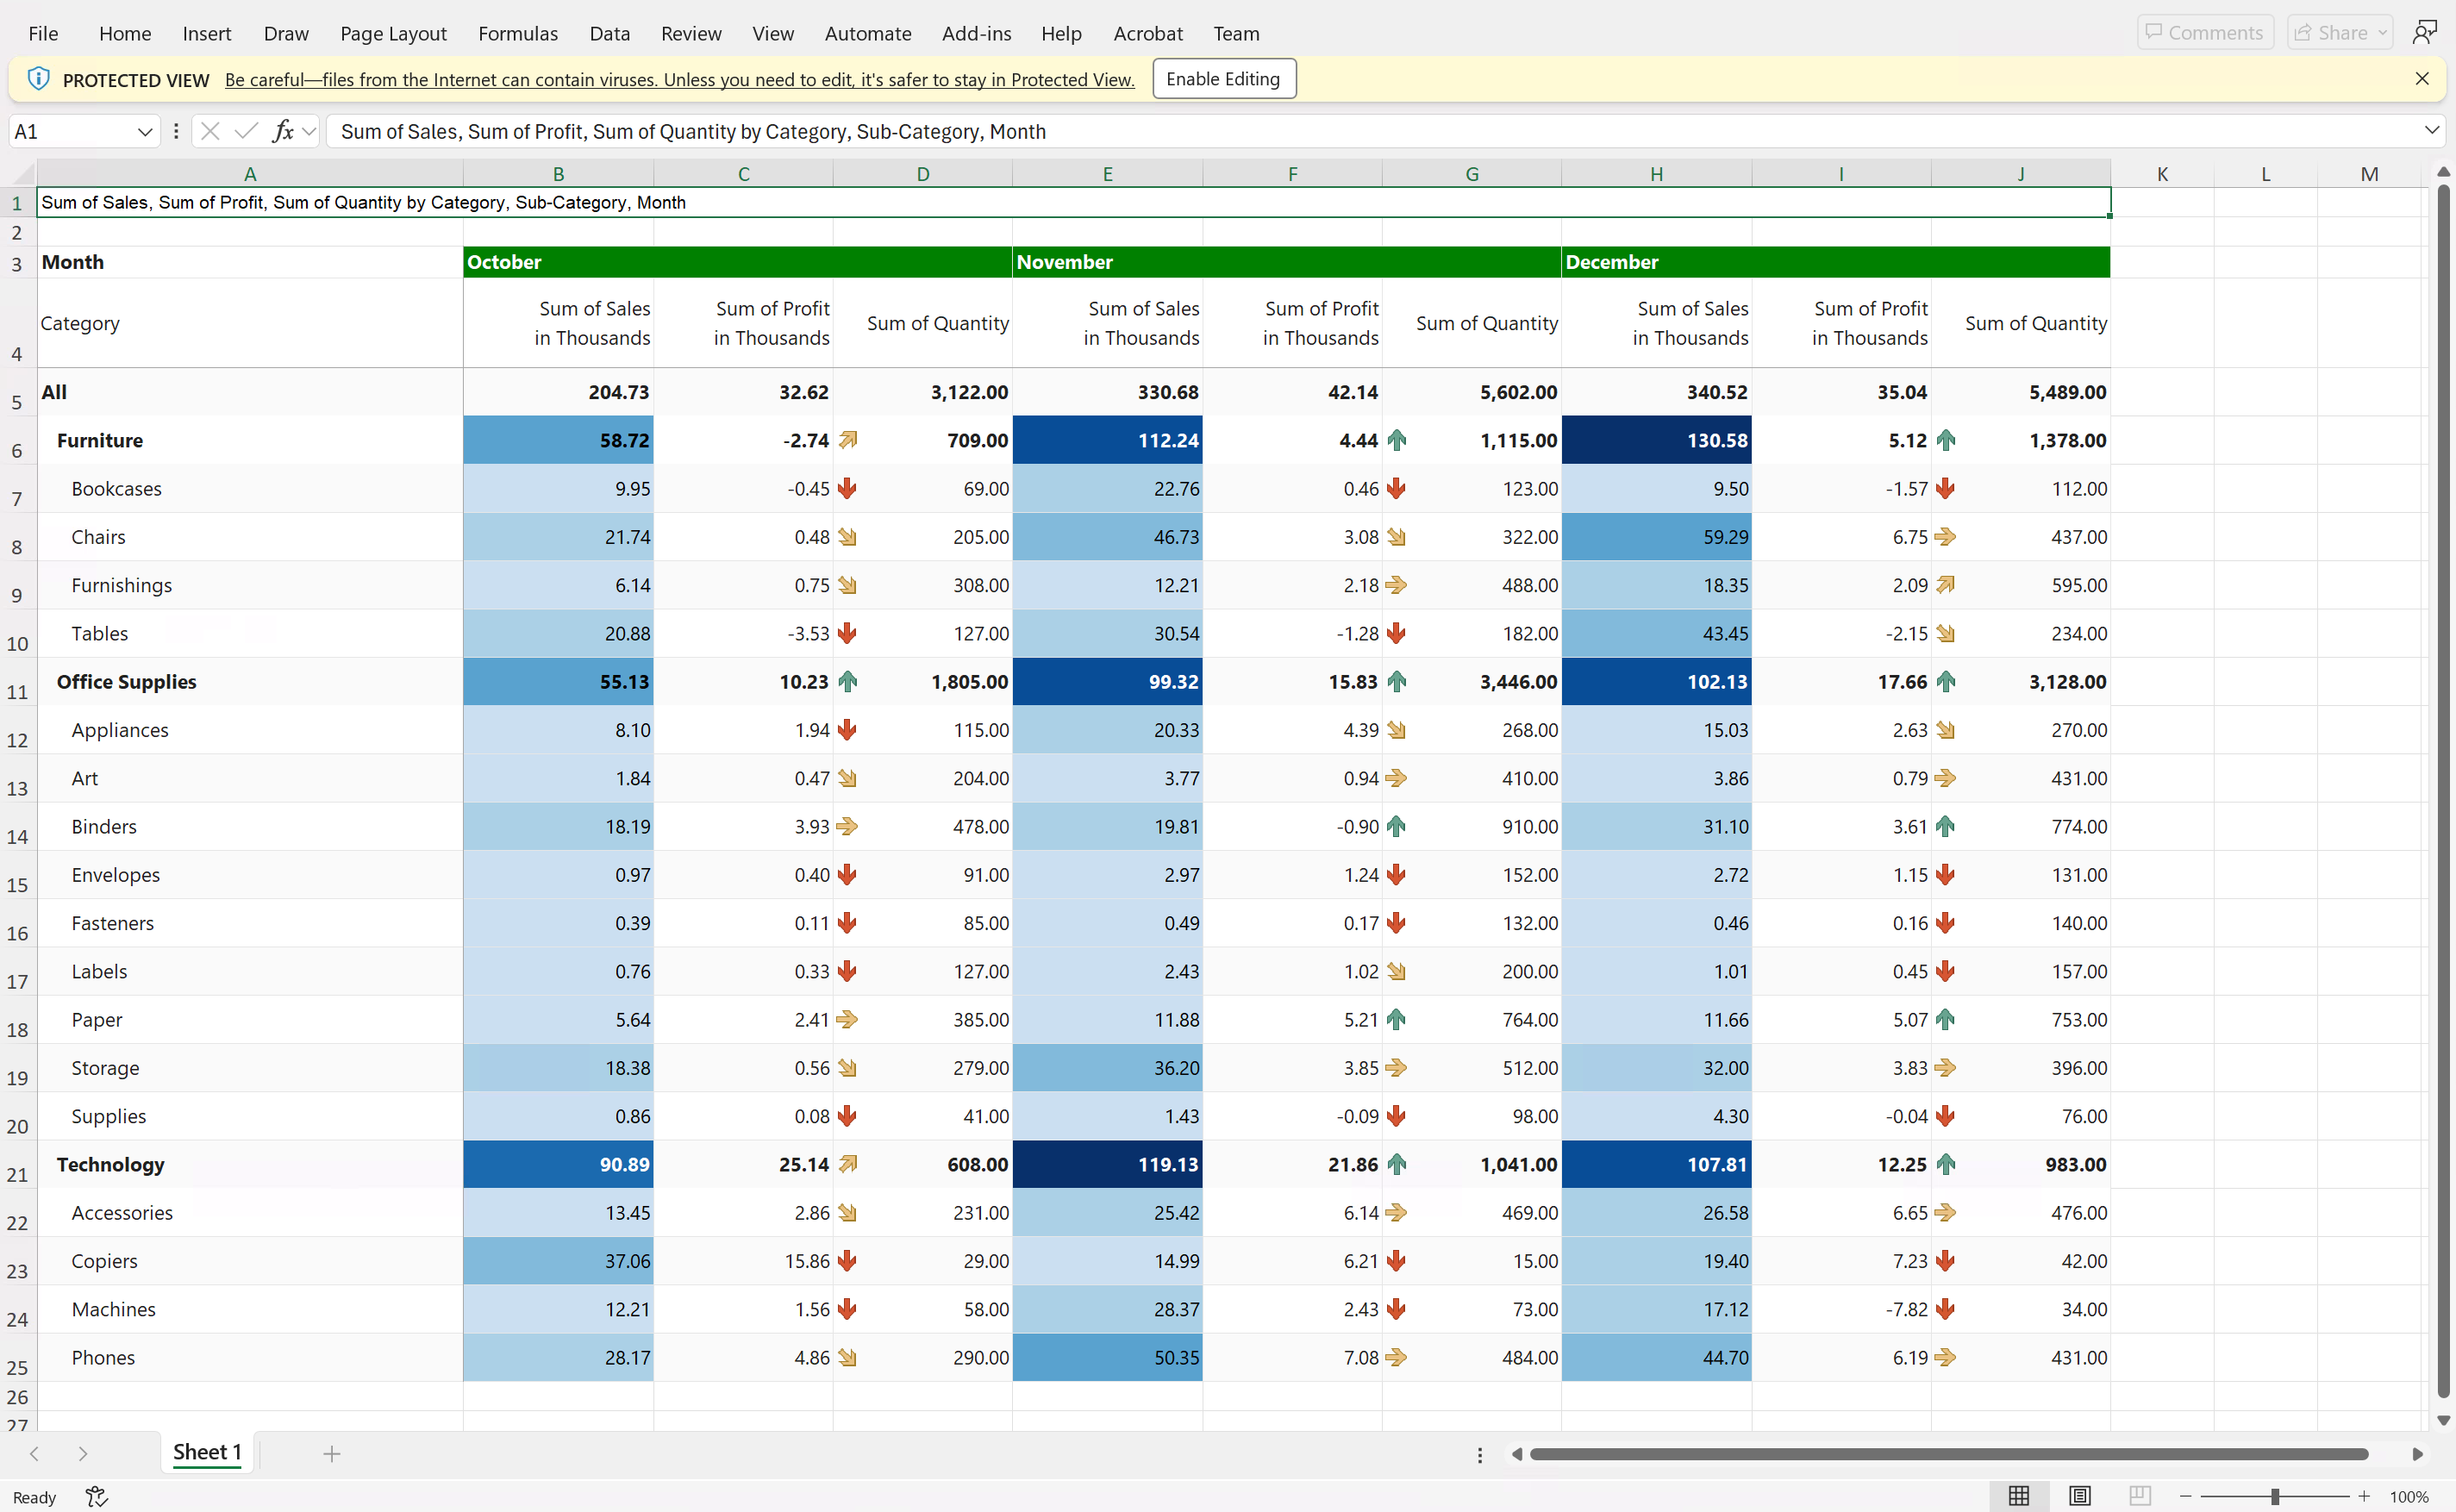
The following image shows a sample Excel export:
#### Import prebuilt templates for KPI cards
Choose from a set of prebuilt KPI card templates to quickly design dashboards and reduce setup time.
1. Go to **Export > Explore Templates**.
2. Select and download a template to apply.
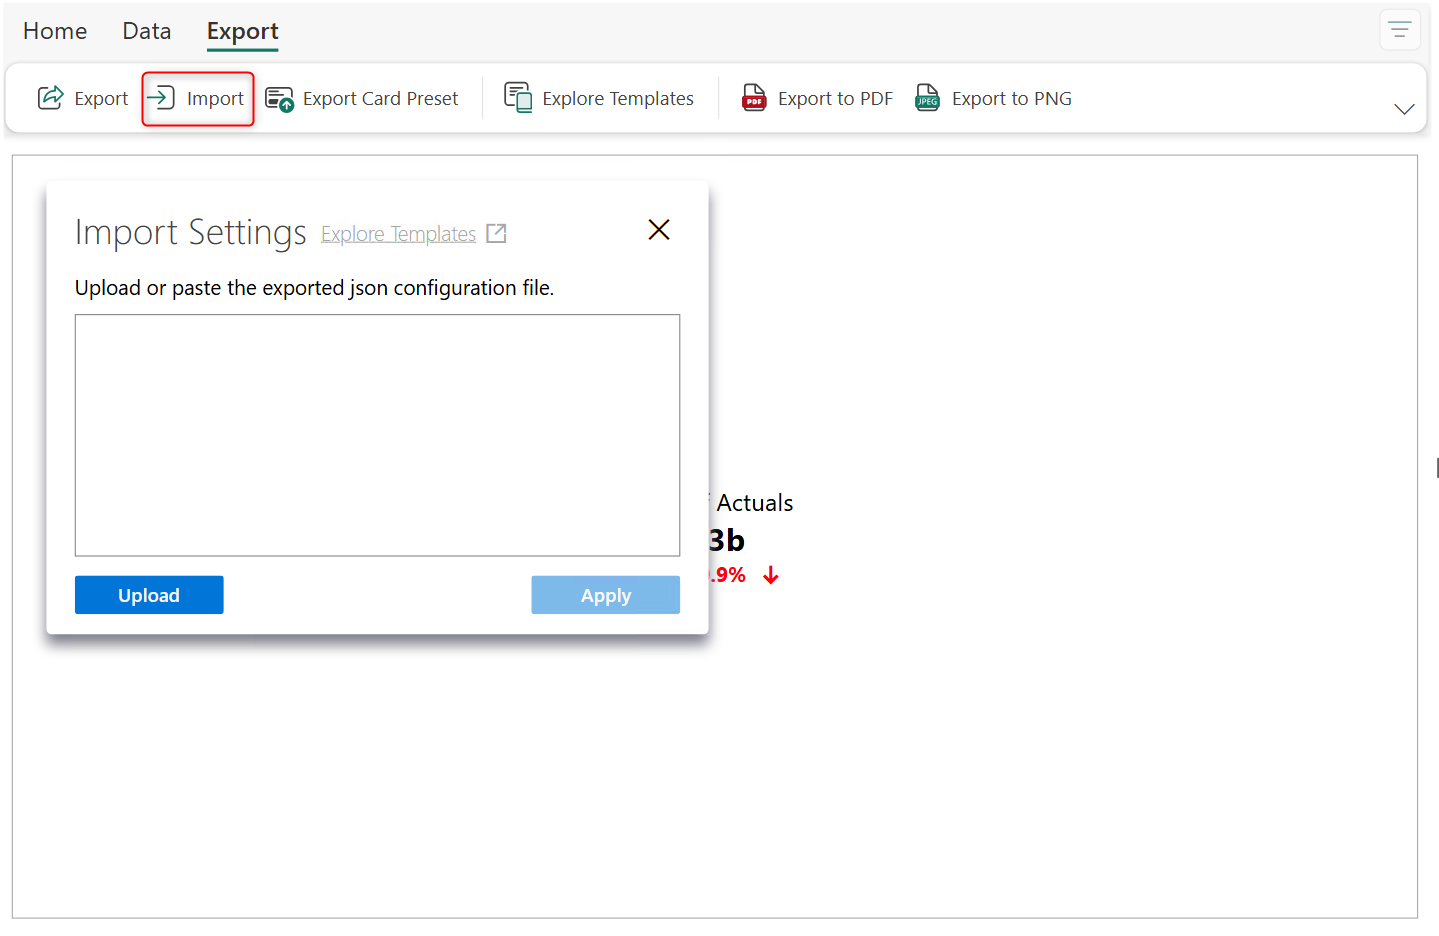
3. Return to the card visual, and then select **Import** from the **Export** ribbon.
4. Click **Upload** and select the template you downloaded in step 2.
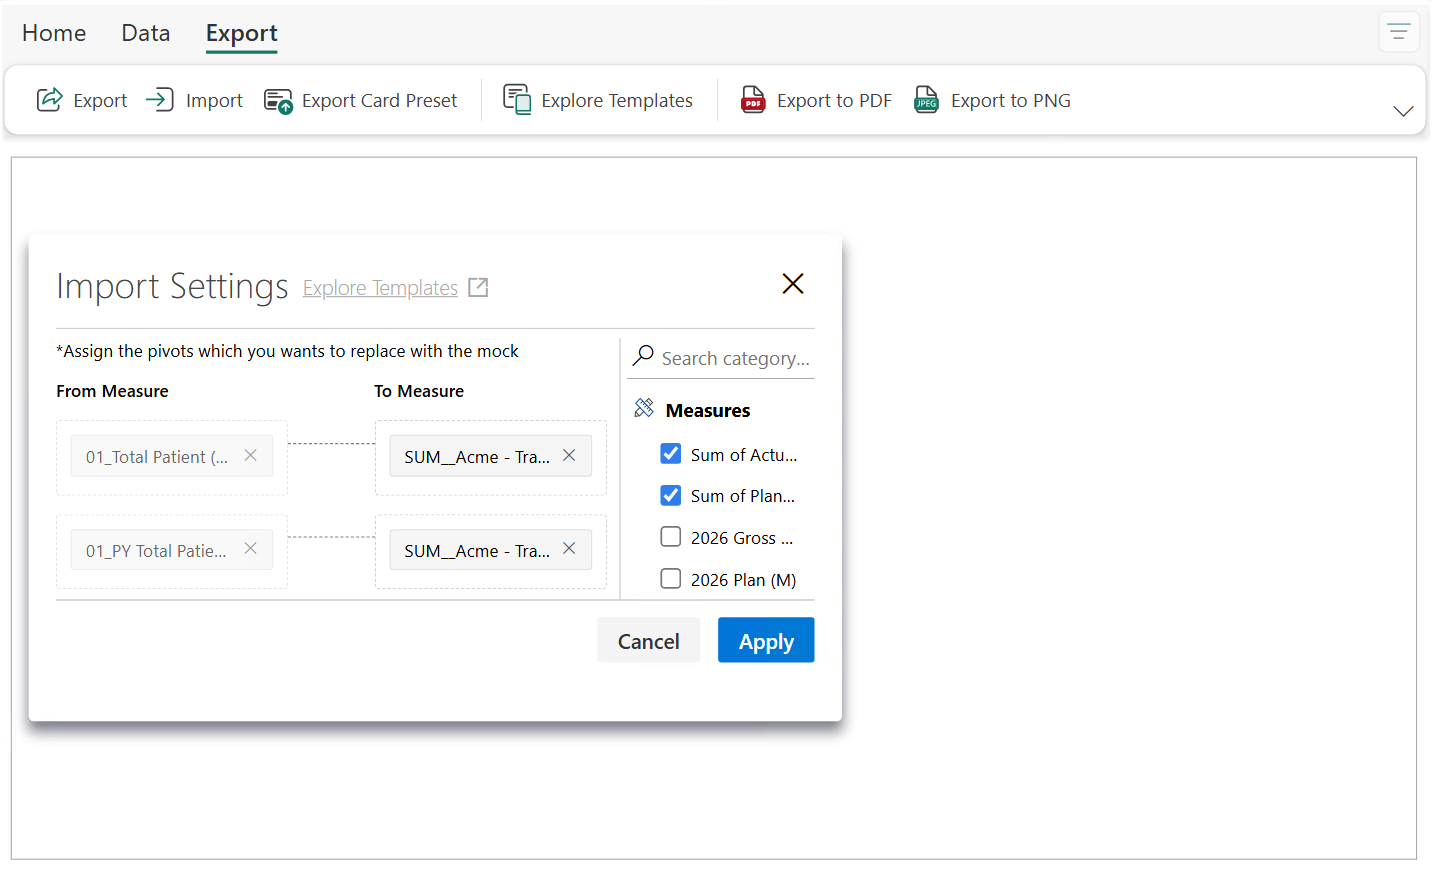
5. Map the measures to the sample measures used in the template.
6. Click **Apply** and when prompted, select **Yes** to confirm.
#### Export chart data
To export the data used to render the chart, right-click the visual, select **Export**, then select **Data**. The underlying data is saved as a CSV file.
---
# Agent Instructions: Querying This Documentation
If you need additional information that is not directly available in this page, you can query the documentation dynamically by asking a question.
Perform an HTTP GET request on the current page URL with the `ask` query parameter:
```
GET https://docs.fabricplan.com/intelligence-sheets/how-tos/export-high-quality-pdf-and-excel-reports.md?ask=
```
The question should be specific, self-contained, and written in natural language.
The response will contain a direct answer to the question and relevant excerpts and sources from the documentation.
Use this mechanism when the answer is not explicitly present in the current page, you need clarification or additional context, or you want to retrieve related documentation sections.